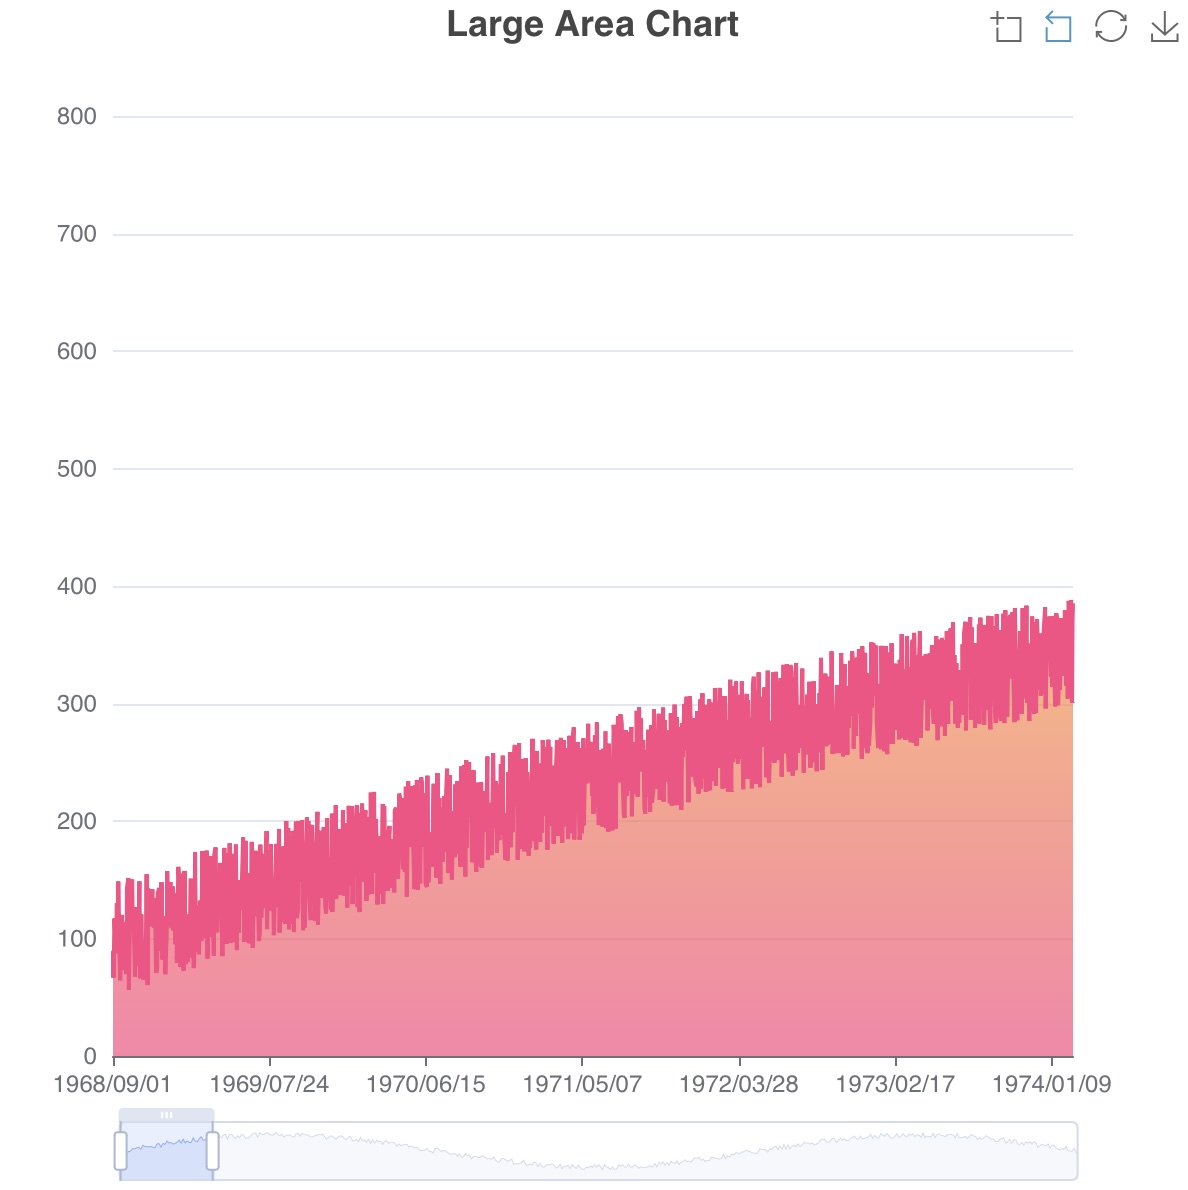
machbase-neoTQLCHART()折れ線グラフ大規模な面グラフ大規模な面グラフページをコピー MarkdownとしてコピーMarkdownとして表示時系列データのダウンサンプリングにLargest-Triangle-Three-Bucketsアルゴリズムを使用します。 1 2 3 4 5 6 7 8 9 10 11 12 13 14 15 16 17 18 19 20 21 22 23 24 25 26 27 28 29 30 31 32 33 34 35 36 37 38 39 40 41 42 43 44 45 46 47 48 49 50 51 52 53 54 55 56 57 58 59 60 61 62 63 64 65 66 67 68 69 70 71 72 73 74 75 76 77 78 79 80 81 82 83 84 85 86 87 88 89 90 91 92 93 FAKE(linspace(0,19999,20000)) // | 0 // +-- n // | -42109200000000000 = エポック時刻 "1968/09/01" に1日を加算 PUSHVALUE(0, -42109200000000000 + value(0)*3600*24*1000000000) // | 0 1 // +-- daily-epoch n // | エポック値をtimeに変換 MAPVALUE(0, time(value(0))) // | 0 1 // +-- time n // | 時刻を日付文字列に変換 MAPVALUE(0, strTime(value(0), sqlTimeformat("YYYY/MM/DD"), tz("Local"))) // | 0 1 // +-- date n // | 乱数値 MAPVALUE(1, sin(value(1)/20000 * 3*PI) * 300 + (100*random())+50) // | 0 1 // +-- date value // | CHART( chartJSCode({ function position(pt) { return [pt[0], '10%']; } function areaColor() { return new echarts.graphic.LinearGradient(0, 0, 0, 1, [ { offset: 0, color: 'rgb(255, 158, 68)' }, { offset: 1, color: 'rgb(255, 70, 131)' } ]); } }), chartOption({ tooltip: { trigger: "axis", position: position }, title: { left: "center", text: "Large Area Chart" }, toolbox: { feature: { dataZoom: { yAxisIndex: "none" }, restore: {}, saveAsImage: {} } }, xAxis: { type: "category", boundaryGap: false, data: column(0) }, yAxis: { type: "value", boundaryGap: [0, "100%"] }, dataZoom: [ { type: "inside", start: 0, end: 10 }, { start: 0, end: 10 } ], series: [ { name: "Fake Data", type: "line", symbol: "none", sampling: "lttb", itemStyle: { color: "rgb(255, 70, 131)" }, areaStyle: { color: areaColor() }, data: column(1) } ] }) )最終更新日 9月 10, 2026複数のY軸データ変換