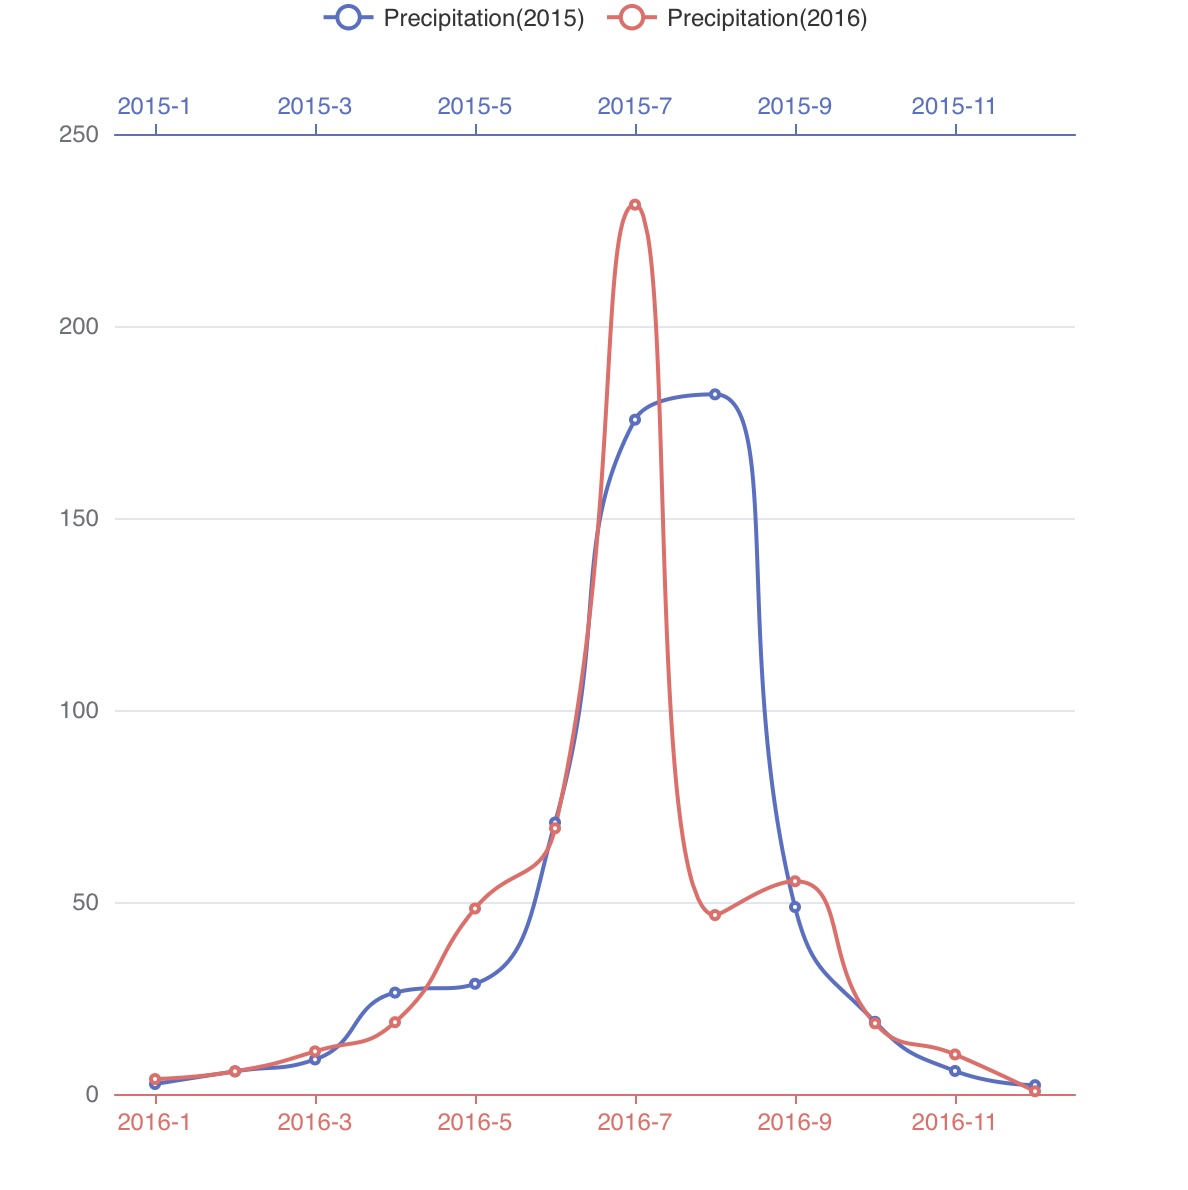
machbase-neoTQLCHART()折れ線グラフ複数のX軸複数のX軸ページをコピー MarkdownとしてコピーMarkdownとして表示 1 2 3 4 5 6 7 8 9 10 11 12 13 14 15 16 17 18 19 20 21 22 23 24 25 26 27 28 29 30 31 32 33 34 35 36 37 38 39 40 41 42 43 44 45 46 47 48 49 50 51 52 53 54 55 56 57 58 59 60 61 62 63 64 65 66 67 68 69 70 71 72 73 74 75 76 77 78 79 80 81 82 83 84 85 86 87 88 89 90 91 92 93 94 95 96 97 98 99 100 101 102 103 104 105 106 107 108 109 110 111 112 113 114 115 116 117 118 119 120 121 122 123 124 125 126 127 128 129 130 131 132 133 134 135 136 137 138 139 140 141 FAKE(csv(`2015-1,2.6 2015-2,5.9 2015-3,9.0 2015-4,26.4 2015-5,28.7 2015-6,70.7 2015-7,175.6 2015-8,182.2 2015-9,48.7 2015-10,18.8 2015-11,6.0 2015-12,2.3 2016-1,3.9 2016-2,5.9 2016-3,11.1 2016-4,18.7 2016-5,48.3 2016-6,69.2 2016-7,231.6 2016-8,46.6 2016-9,55.4 2016-10,18.4 2016-11,10.3 2016-12,0.7 `)) PUSHVALUE(1, value(0)) // | 0 1 2 // + YYYY-M YYYY-M value // | MAPVALUE(1, strHasPrefix(value(1), "2015-") ? "2015" : value(1)) MAPVALUE(1, strHasPrefix(value(1), "2016-") ? "2016" : value(1)) // | 0 1 2 // + YYYY-M YYYY value // | PUSHVALUE(2, strSub(value(0), 5) ) // | 0 1 2 3 // + YYYY-M YYYY Month value // | GROUP( by(parseFloat(value(2))), max(value(3), where(value(1) == "2016")), max(value(3), where(value(1) == "2015")), lazy(true) ) // | 0 1 2 // + Month 2015-value 2016-value // | MAPVALUE(1, list(strSprintf("2015-%.f",value(0)), value(1))) MAPVALUE(2, list(strSprintf("2016-%.f",value(0)), value(2))) // | 0 1 2 // + Month ["2015-M", 2015-value] ["2015-M", 2016-value] // | CHART( chartJSCode({ function colors() { return ['#5470C6', '#EE6666']; } function labelformat (params) { return ( 'Precipitation ' + params.value + (params.seriesData.length ? ':' + params.seriesData[0].data : '') ); } }), chartOption({ color: colors(), tooltip: { trigger: "none", axisPointer: { type: "cross" } }, legend: {}, grid: { top: 70, bottom: 50 }, xAxis: [ { type: "category", axisTick: { alignWithLabel: true }, axisLine: { onZero: false, lineStyle: { color: colors()[1] } }, axisPointer: { label: { formatter: labelformat } } }, { type: "category", axisTick: { alignWithLabel: true }, axisLine: { onZero: false, lineStyle: { color: colors()[0] } }, axisPointer: { label: { formatter: labelformat } } } ], yAxis: [ { type: "value" } ], series: [ { name: "Precipitation(2015)", type: "line", xAxisIndex: 1, smooth: true, emphasis: { focus: "series" }, data: column(1) }, { name: "Precipitation(2016)", type: "line", xAxisIndex: 0, smooth: true, emphasis: { focus: "series" }, data: column(2) } ] }) )最終更新日 9月 10, 2026直交座標系複数のY軸