예제
HTTP 서버
이 예제는 @jsh/http 모듈을 사용하여 간단한 HTTP 서버를 구현하는 방법을 안내해 드립니다.
서버는 지정한 주소와 포트(127.0.0.1:56802)에서 요청을 수신하며 /hello/:name REST API 엔드포인트를 제공합니다.
클라이언트가 이름 매개변수를 포함한 GET 요청을 보내면,
서버는 인사 메시지와 전달받은 이름이 들어 있는 JSON 객체로 응답합니다.
동적 라우팅과 JSON 응답을 활용한 경량 HTTP 서버 작성 방법을 익히기에 적합한 예제입니다.
주요 특징
- 데몬 처리: 스크립트는
process.ppid()로 데몬 실행 여부를 확인하고, 아닐 경우process.daemonize()를 호출해 백그라운드에서 동작하도록 전환합니다. - 라우팅:
/hello/:name라우트에서 URL 경로에 포함된name값을 추출합니다. - JSON 응답: 이름과 환영 메시지를 담은 JSON 객체를 반환합니다.
| |
사용 절차
- 스크립트를 실행하여 서버를 기동합니다.
curl과 같은 도구로 서버에 GET 요청을 보냅니다.
curl -o - http://127.0.0.1:56802/hello/Karl서버는 다음과 같이 응답합니다.
{"message":"greetings","name":"Karl"}유닉스 도메인 소켓
이 예제는 TCP/IP 대신 유닉스 도메인 소켓을 이용해 통신하는 HTTP 서버 구현 방법을 보여 드립니다. 같은 호스트에서 프로세스 간 통신(IPC)이 필요할 때 네트워크 오버헤드 없이 활용하실 수 있습니다.
동작 흐름
- 유닉스 도메인 소켓 통신
- 로컬 통신을 위해 파일 기반 소켓(
/tmp/service.sock)을 사용합니다.
- 로컬 통신을 위해 파일 기반 소켓(
- 효율적인 IPC
- 동일한 서버의 프로세스 간 통신을 네트워크 없이 처리할 수 있습니다.
- 도구 호환성
curl과 같은 도구로 테스트 및 상호 작용이 가능합니다.
| |
유닉스 도메인 소켓을 통해 서버에 요청하려면 다음과 같이 입력하십시오.
curl -o - --unix-socket /tmp/service.sock http://localhost/hello/Karl정적 콘텐츠
정적 파일이나 디렉터리를 제공하려면 아래와 같이 설정하십시오.
| |
리다이렉트
특정 경로로 이동시키고자 할 때는 다음과 같이 리다이렉션을 지정합니다.
| |
RESTful API
아래 예제는 목록 조회, 등록, 삭제 요청을 처리하는 기본 REST API 구현입니다.
| |
다음 명령으로 각 호출을 확인하실 수 있습니다.
- GET 요청
curl -o - http://127.0.0.1:56802/movies[
{ "id": 59793, "studio": [ "Paramount" ], "title": "Indiana Jones" },
{ "id": 64821, "studio": [ "Lucasfilm" ], "title": "Star Wars" }
]- POST 요청
curl -o - -X POST http://127.0.0.1:56802/movies \
    -H "Content-Type: application/json" \
-d '{"title":"new movie", "id":12345, "studio":["Unknown"]}'- DELETE 요청
curl -v -o - -X DELETE http://127.0.0.1:56802/movies/12345< HTTP/1.1 204 No Content
< Content-Type: text/plain; charset=utf-8
< Date: Thu, 08 May 2025 20:39:34 GMT
<HTML 템플릿
다음 설정은 /*.html 패턴과 일치하는 모든 HTML 템플릿을 로드합니다.
템플릿을 사용하면 미리 정의된 레이아웃과 실행 시간 데이터를 조합해 동적으로 HTML 응답을 생성하실 수 있습니다.
svr.loadHTMLGlob("/*.html")

// /movielist 라우트를 정의하여 HTML 페이지를 제공합니다.
svr.get("/movielist", ctx => {
    obj = {
        subject: "Movie List",
        list: [
            {title:"Indiana Jones", id: 59793, studio: ["Paramount"]},
            {title:"Star Wars", id: 64821, studio: ["Lucasfilm"]},
        ]
    }
    ctx.HTML(http.status.OK, "movie_list.html", obj)
})- HTML 템플릿 코드
movie_list.html
<html>
    <body>
        <h1>{{.subject}}</h1>
        <ol>
        {{range .list }}
            <li> {{.id}} {{.title}} {{.studio}}
        {{end}}
        </ol>
    </body>
</html>
/movielist 엔드포인트에 GET 요청을 보내면,
서버는 movie_list.html 템플릿과 obj 데이터를 이용해 HTML 페이지를 생성합니다.
curl -o - http://127.0.0.1:56802/movielist<html>
<body>
<h1>Movie List</h1>
<ol>
<li> 59793 Indiana Jones [Paramount]
<li> 64821 Star Wars [Lucasfilm]
</ol>
</body>
</html>HTTP 클라이언트
이 예제는 @jsh/http 모듈을 사용해 HTTP 클라이언트를 구성하는 방법을 보여 드립니다.
클라이언트는 지정한 URL로 GET 요청을 전송하고 서버 응답을 처리합니다.
JavaScript에서 HTTP 요청을 다루고 JSON 응답을 파싱하는 과정을 익히시기에 적합합니다.
주요 특징
- 요청 처리: 서버로 HTTP GET 요청을 전송합니다.
- 응답 파싱: 응답에서 상태, 헤더, 본문을 추출합니다.
- 오류 처리:
try-catch블록으로 요청 중 발생할 수 있는 오류를 다룹니다.
| |
사용 절차
- HTTP 서버 예제와 같이 서버가 실행 중인지 확인하십시오.
- 스크립트를 실행하여 서버에 GET 요청을 전송합니다.
유닉스 도메인 소켓
유닉스 도메인 소켓으로 연결하려면 {unix: "/path/to/unix_domain_socket/file"} 옵션을 사용하십시오.
| |
MQTT 퍼블리셔
다음 코드는 MQTT 브로커에 주기적으로 메시지를 게시하는 예제입니다.
mqtt.js파일을 생성하고 아래 코드를 저장하십시오.
| |
MQTT 구독자
이 예제는 MQTT 브로커에 연결하여 특정 토픽을 구독하고 수신 메시지를 처리하는 백그라운드 애플리케이션을 구현하는 방법을 보여 드립니다.
@jsh/process와 @jsh/mqtt 모듈을 이용해 데몬 형태로 실행되며, 연결 수립·메시지 수신·연결 종료와 같은 이벤트를 안정적으로 처리합니다.
실시간 메시지 처리나 경량 백그라운드 작업이 필요한 경우에 활용하시기 좋은 패턴입니다.
mqtt-sub.js파일을 생성하고 아래 코드를 저장하십시오.
| |
Machbase 클라이언트
이 예제는 포트 5656을 통해 다른 Machbase 인스턴스에 접속하고 쿼리를 실행하는 방법을 보여 드립니다.
8행의 lowerCaseColumns: true 설정을 사용하면 21행에서처럼 결과 레코드의 속성명이 소문자로 정규화됩니다.
dataSource는 아래 두 가지 형식을 모두 지원합니다.
- 클래식 형식:
SERVER=${host};PORT_NO=${port};UID=${user};PWD=${pass} - 이름=값 형식:
host=<ip> port=<port> user=<username> password=<pass>
| |
Machbase Append
아래 코드는 Machbase 테이블에 일괄 데이터를 추가하는 방법을 보여 드립니다.
| |
SQLite 클라이언트
이 예제는 @jsh/db 모듈로 메모리 기반 SQLite 데이터베이스를 생성하고, 테이블 생성·데이터 삽입·조회 작업을 수행하는 방법을 보여 드립니다.
| |
실행하면 삽입된 레코드가 다음과 같이 출력됩니다.
1 Fedel-Gaylord 12PostgreSQL 클라이언트
PostgreSQL 서버에 연결해 테이블을 생성하고 데이터를 삽입·조회하는 예제입니다.
| |
System Monitoring
데이터 수집기
이 시스템 모니터링 예제는 @jsh/process와 @jsh/psutil 모듈을 활용해 경량 모니터링 도구를 구성하는 방법을 보여 드립니다.
스크립트는 데몬으로 실행되며 1, 5, 15분 평균 부하와 CPU·메모리 사용률을 주기적으로 수집합니다.
크론과 유사한 구문을 사용해 15초마다 작업을 실행하고, 수집한 데이터를 타임스탬프와 함께 저장합니다. JavaScript로 프로세스를 관리하고 실시간 지표를 적재하는 예시로 참고하실 수 있습니다.
코드를 sysmon.js로 저장한 뒤 JSH 터미널에서 실행하십시오.
시스템 부하와 CPU·메모리 지표는 EXAMPLE 테이블에 기록됩니다.
jsh / > sysmon
jsh / > ps
┌──────┬──────┬──────┬─────────────────┬──────────┐
│  PID │ PPID │ USER │ NAME            │ UPTIME   │
├──────┼──────┼──────┼─────────────────┼──────────┤
│ 1040 │ 1    │ sys  │ /sysmon.js      │ 2h37m43s │
│ 1042 │ 1025 │ sys  │ ps              │ 0s       │
└──────┴──────┴──────┴─────────────────┴──────────┘ - sysmon.js
| |
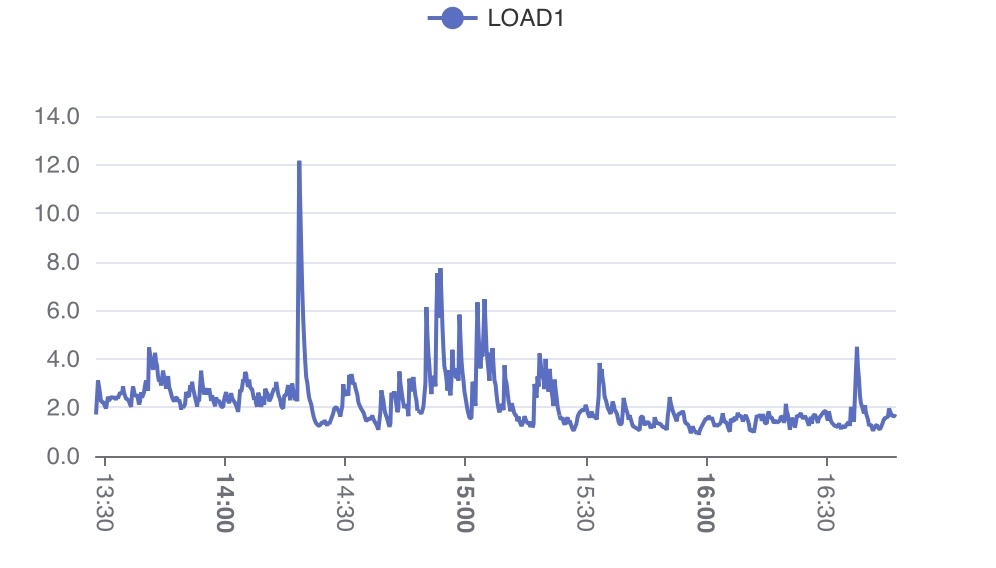
차트 TQL
수집한 시스템 지표가 데이터베이스에 저장되므로, TQL로 손쉽게 조회하고 시각화할 수 있습니다.
| |
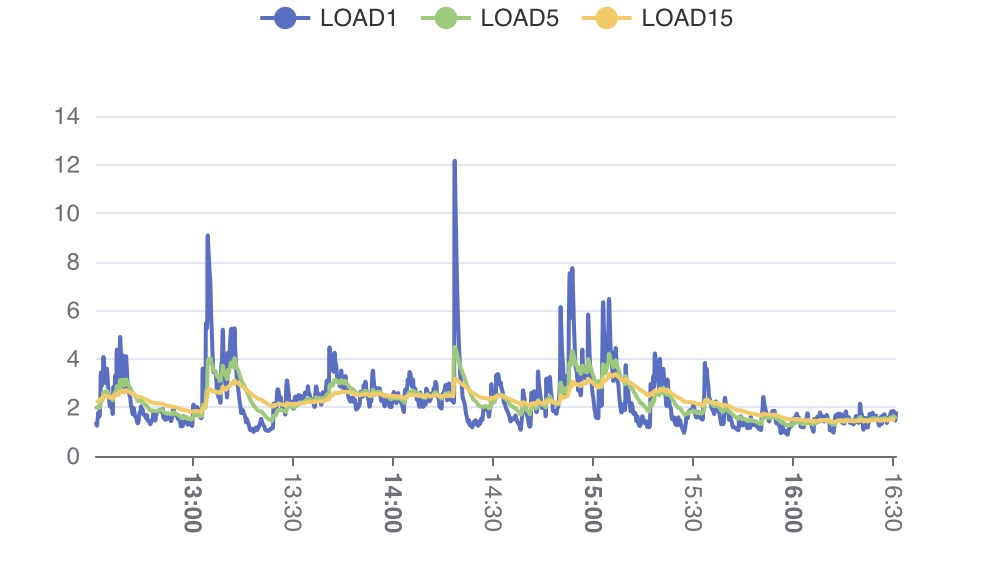
SCRIPT() 활용 차트 TQL
| |
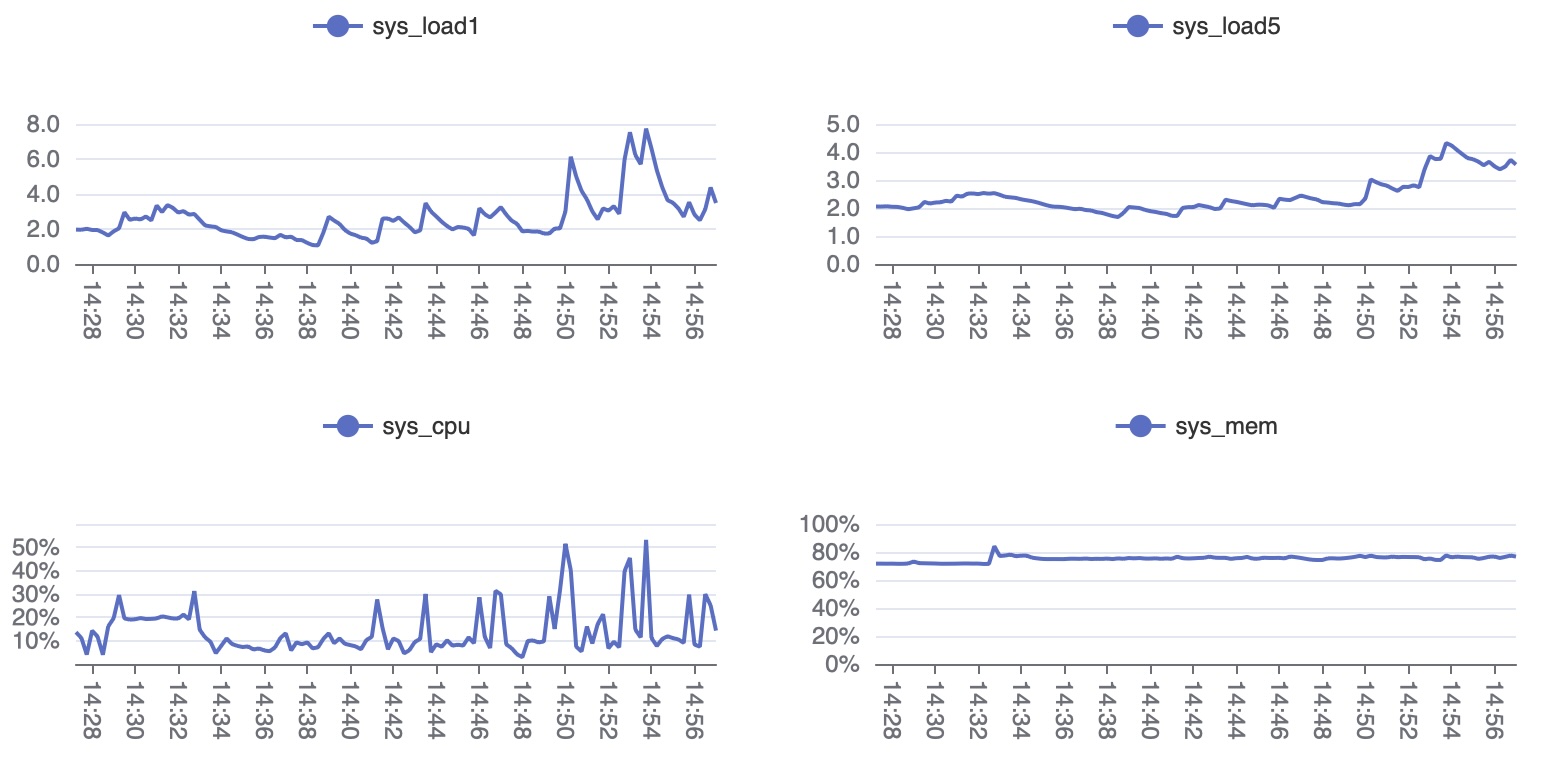
HTML에서 차트 그리기
다음 HTML을 sysmon.html로 저장한 뒤 브라우저에서 열면 수집한 시스템 모니터링 데이터를 시각화할 수 있습니다.
- sysmon.html
| |
HTML 템플릿 차트
이 예제는 /sysmon 경로를 제공하는 HTTP 서버를 구성해 템플릿 기반 차트를 반환하는 방법을 보여 드립니다.
서버는 데이터베이스에서 부하·CPU·메모리 지표를 조회한 뒤 ECharts 템플릿(http-sysmon.html)에 주입해 실시간으로 시각화합니다.
sysmon-server.js
| |
http-sysmon.html
<html>
<head>
    <script src="https://cdn.jsdelivr.net/npm/echarts@5.6.0/dist/echarts.min.js"></script>
</head>
<body>
<div style='display:flex;float:left;flex-flow:row wrap;width:100%;'>
    <div id="load" style="width:400px;height:300px;margin:4px;"></div>
    <div id="cpu" style="width:400px;height:300px;margin:4px;"></div>
    <div id="mem" style="width:400px;height:300px;margin:4px;"></div>
</div>
<script>
    function doChart(element, title, data) {
        let chart = echarts.init(element, "dark");
        chart.setOption({
            animation:false, "color":["#80FFA5", "#00DDFF", "#37A2FF"],
            title:{"text":title},
            legend:{ bottom: 7 }, tooltip:{"trigger":"axis"},
            xAxis:{type:"time", axisLabel:{ rotate: -90 }},
            yAxis:{type:"value"},
            series: data,
        });
    }
    doChart(document.getElementById('load'), "System Load Avg.", [
        { type:"line", name:"load1", symbol:"none", data:{{.load1}} },
        { type:"line", name:"load5", symbol:"none", data:{{.load5}} },
        { type:"line", name:"load15", symbol:"none", data:{{.load15}} },
    ])
    doChart(document.getElementById('cpu'), "CPU Usage", [
        { type:"line", name:"cpu usage", symbol:"none", data:{{.cpu}} },
    ])
    doChart(document.getElementById('mem'), "Memory Usage", [
        { type:"line", name:"mem usage", symbol:"none", data:{{.mem}} },
    ])
</script>
</body>
</html>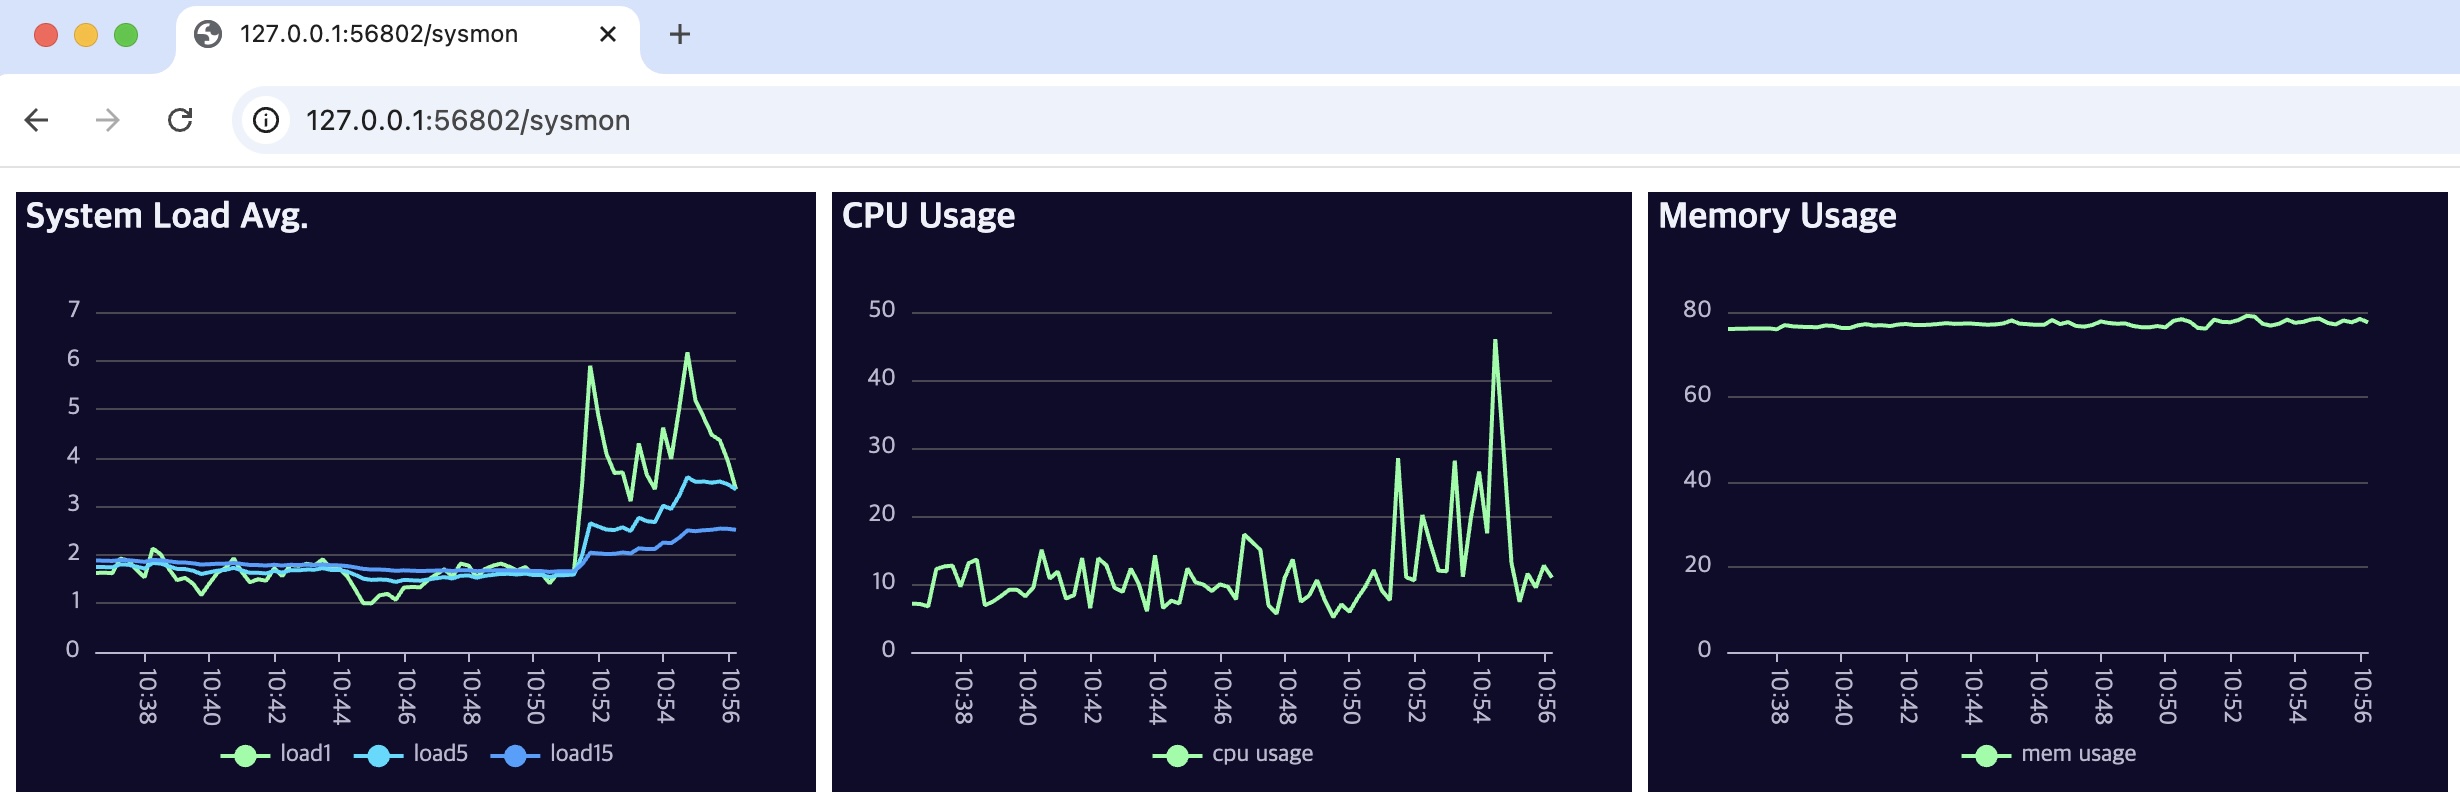
OPCUA 클라이언트
이 예제는 OPC UA 서버에 연결해 시스템 지표를 읽고 데이터베이스에 저장하는 수집기를 구현합니다.
동작 흐름
- OPC UA 연동:
@jsh/opcua모듈을 사용해opc.tcp://localhost:4840서버에 연결하고cpu_percent,mem_percent,load1등 노드 값을 조회합니다. - 주기 수집:
process.schedule을 활용해 10초마다 데이터를 읽습니다. - 데이터 적재: 수집한 값은
EXAMPLE테이블에name,time,value컬럼으로 저장합니다. - 시각화: System Monitoring 절에서 소개한 TQL이나 HTML 차트 예제를 그대로 활용하실 수 있습니다.
데이터 수집기
스크립트를 opcua-client.js로 저장한 뒤 JSH 터미널에서 백그라운드로 실행하십시오.
jsh / > opcua-client
jsh / > ps
┌──────┬──────┬──────┬──────────────────┬────────┐
│  PID │ PPID │ USER │ NAME             │ UPTIME │
├──────┼──────┼──────┼──────────────────┼────────┤
│ 1044 │ 1    │ sys  │ /opcua-client.js │ 13s    │
│ 1045 │ 1025 │ sys  │ ps               │ 0s     │
└──────┴──────┴──────┴──────────────────┴────────┘ - opcua-client.js
| |
시뮬레이터 서버
opcua-client.js를 시험하려면 필요한 시스템 지표 노드를 제공하는 OPC UA 서버가 필요합니다.
실환경이 없다면 아래 저장소에서 제공하는 시뮬레이터를 사용해 주십시오.
sys_cpu, sys_mem, load1, load5, load15 등의 샘플 데이터를 제공하여 수집기 및 시각화 흐름을 검증하실 수 있습니다.
설정 방법은 저장소의 안내를 따르시면 됩니다.
https://github.com/machbase/neo-server/tree/main/mods/jsh/opcua/test_server
시뮬레이터를 실행한 뒤 opcua-client.js를 가동하면 OPC UA 클라이언트가 정상적으로 연결되어 데이터를 수집합니다.
통계
다음 TQL 예제는 @jsh/analysis 모듈을 사용해 숫자 배열의 기초 통계량을 계산하는 방법을 보여 드립니다.
평균, 중앙값, 분산, 표준편차를 구한 뒤 $.yield()로 반환하여 CSV 등으로 손쉽게 활용할 수 있습니다.
| |