vizspec
vizspec 모듈은 ADVN 문서를 생성하고, 검증하고, 파싱하고, 다른 출력 형식으로 변환하는 JSH API입니다.
ADVN은 Analysis Data Visualization Notation의 약자로, 분석 결과 시각화를 위한 renderer-중립 문서 형식입니다.
ADVN을 사용하면 데이터의 의미와 renderer-specific 출력을 분리할 수 있습니다.
ADVN과 vizspec
- ADVN은 의미 중심의 semantic layer 입니다.
- ADVN은 문서 형식입니다. 분석 결과가 무엇을 의미하는지 표현합니다.
vizspec모듈은 ADVN 문서를 생성하고 변환하는 JSH API입니다.viz는 ADVN 문서를 검증하고 미리 보고 내보내는 명령어입니다.
기본 예제
| |
상수
모듈은 다음 상수 그룹을 제공합니다.
RepresentationKindAnnotationKindTimeformat
애플리케이션 코드에서 ADVN 값을 명시적으로 지정할 때 이 상수들을 사용하면 오타를 줄일 수 있습니다.
RepresentationKind
| Member | Value | Description |
|---|---|---|
RepresentationKind.rawPoint | raw-point | [x, y] 형태의 raw point sample 입니다. |
RepresentationKind.timeBucketValue | time-bucket-value | 단일 numeric value 를 가진 time bucket 집계 표현입니다. |
RepresentationKind.timeBucketBand | time-bucket-band | min/max/avg band 값을 가진 time bucket 집계 표현입니다. |
RepresentationKind.distributionHistogram | distribution-histogram | Histogram distribution bucket 표현입니다. |
RepresentationKind.distributionBoxplot | distribution-boxplot | Boxplot distribution group 표현입니다. |
RepresentationKind.eventPoint | event-point | 하나의 time/value 지점에 발생한 instant event 표현입니다. |
RepresentationKind.eventRange | event-range | from/to 시간 범위를 가진 duration event 표현입니다. |
AnnotationKind
| Member | Value | Description |
|---|---|---|
AnnotationKind.point | point | 하나의 위치를 가리키는 point annotation 입니다. |
AnnotationKind.line | line | threshold 또는 reference line annotation 입니다. |
AnnotationKind.range | range | 범위를 강조하는 range annotation 입니다. |
Timeformat
| Member | Value | Description |
|---|---|---|
Timeformat.rfc3339 | rfc3339 | RFC3339 문자열 시간 표현입니다. |
Timeformat.s | s | epoch seconds 입니다. |
Timeformat.ms | ms | epoch milliseconds 입니다. |
Timeformat.us | us | epoch microseconds 입니다. |
Timeformat.ns | ns | epoch nanoseconds 입니다. |
parse()
ADVN JSON 문자열을 파싱해서 정규화된 spec object 를 반환합니다.
사용 형식
parse(text)파라미터
| Name | Type | Description |
|---|---|---|
text | string | 파싱할 ADVN JSON 문자열입니다. |
사용 예시
| |
stringify()
spec object 를 ADVN JSON 문자열로 직렬화합니다.
사용 형식
stringify(spec)파라미터
| Name | Type | Description |
|---|---|---|
spec | object | 직렬화할 ADVN spec object 입니다. |
사용 예시
| |
validate()
spec object 를 검증합니다. 구조나 필드 조합이 잘못되면 예외를 발생시킵니다.
사용 형식
validate(spec)파라미터
| Name | Type | Description |
|---|---|---|
spec | object | 검증할 ADVN spec object 입니다. |
사용 예시
| |
normalize()
부분적으로 작성된 spec object 를 정규화하고 기본 구조 필드를 채웁니다.
사용 형식
normalize(spec)파라미터
| Name | Type | Description |
|---|---|---|
spec | object | 정규화할 부분 ADVN spec object 입니다. |
사용 예시
| |
createSpec()
initializer 로부터 spec object 를 생성하고, 정규화하고, 검증합니다.
사용 형식
createSpec(init)파라미터
| Name | Type | Description |
|---|---|---|
init | object | ADVN spec 초기값 object 입니다. |
사용 예시
| |
listSeries()
spec.series 의 정규화된 요약 목록을 반환합니다.
사용 형식
listSeries(spec)파라미터
| Name | Type | Description |
|---|---|---|
spec | object | 확인할 ADVN spec object 입니다. |
반환 필드
| Field | Type | Description |
|---|---|---|
index | integer | spec.series 안의 0-based series index 입니다. |
id | string | Series id 입니다. |
name | string | 지정된 경우 series name 입니다. |
title | string | 표시 제목입니다. name 이 있으면 name, 없으면 id 를 사용합니다. |
kind | string | Representation kind 입니다. |
tuiLinesCompatible | boolean | toTUILines() 로 렌더링 가능한 series 인지 여부입니다. |
사용 예시
| |
Series helper
Series helper 함수는 올바른 representation kind 와 기본 field 구성을 가진 series object 를 만듭니다.
사용 가능한 helper:
rawPointSeries(init)timeBucketValueSeries(init)timeBucketBandSeries(init)distributionHistogramSeries(init)distributionBoxplotSeries(init)eventPointSeries(init)eventRangeSeries(init)
사용 형식
timeBucketValueSeries(init)
eventRangeSeries(init)
공통 initializer 필드
| Name | Type | Description |
|---|---|---|
id | string | Series 식별자입니다. |
name | string | Adapter 에서 사용할 표시 이름입니다. |
axis | string | Numeric renderer 에서 사용할 y-axis id 입니다. |
representation | object | field 또는 representation 메타데이터 override 에 사용합니다. |
data | array | Series payload row 배열입니다. |
style | object | color, opacity 같은 renderer hint style 값입니다. |
quality | object | coverage, rowCount 같은 quality 메타데이터입니다. |
source | object | Series provenance 메타데이터입니다. |
extra | object | boxplot outlier 같은 representation-specific extra 데이터입니다. |
사용 예시
| |
Annotation helper
Annotation helper 함수는 올바른 annotation kind 를 가진 top-level annotation object 를 만듭니다.
사용 가능한 helper:
pointAnnotation(init)lineAnnotation(init)rangeAnnotation(init)
사용 형식
lineAnnotation(init)
rangeAnnotation(init)
공통 initializer 필드
| Name | Type | Description |
|---|---|---|
axis | string | 대상 axis id 입니다. |
label | string | 사람이 읽을 annotation label 입니다. |
value | any | line 또는 point annotation 에 사용할 값입니다. |
at | any | point annotation 위치값입니다. |
from | any | range 시작값입니다. |
to | any | range 종료값입니다. |
style | object | 선택적인 renderer hint style 값입니다. |
사용 예시
| |
Builder
fluent style 로 ADVN 문서를 만들고 싶다면 builder 를 사용하십시오.
사용 형식
new Builder([init])주요 메서드
| Method | Description |
|---|---|
setDomain(definition) | spec.domain 을 설정합니다. |
setXAxis(definition) | spec.axes.x 를 설정합니다. |
addYAxis(definition) | y-axis 정의를 하나 추가합니다. |
addRawPointSeries(definition) | raw-point series 를 추가합니다. |
addTimeBucketValueSeries(definition) | time-bucket-value series 를 추가합니다. |
addTimeBucketBandSeries(definition) | time-bucket-band series 를 추가합니다. |
addDistributionHistogramSeries(definition) | histogram series 를 추가합니다. |
addDistributionBoxplotSeries(definition) | boxplot series 를 추가합니다. |
addEventPointSeries(definition) | event-point series 를 추가합니다. |
addEventRangeSeries(definition) | event-range series 를 추가합니다. |
addAnnotation(definition) | annotation object 를 추가합니다. |
addLineAnnotation(definition) | line annotation 을 추가합니다. |
addRangeAnnotation(definition) | range annotation 을 추가합니다. |
setView(definition) | spec.view 를 설정합니다. |
setMeta(definition) | spec.meta 를 설정합니다. |
build() | 정규화된 spec 을 반환합니다. |
stringify() | build 결과를 문자열로 직렬화합니다. |
listSeries() | 정규화된 series 요약 목록을 반환합니다. |
toEChartsOption(options) | build 결과를 ECharts option 으로 변환합니다. |
toTUILines(options) | build 결과를 terminal 친화적인 TUI chart line 배열로 변환합니다. |
toTUIBlocks(options) | build 결과를 TUI block 배열로 변환합니다. |
toSVG(options) | build 결과를 SVG 문자열로 변환합니다. |
toPNG([svgOptions[, pngOptions]]) | build 결과를 PNG binary data 로 변환합니다. |
사용 예시
| |
Output adapter
toEChartsOption()
spec 을 ECharts option object 로 변환합니다.
사용 형식
toEChartsOption(spec[, options])파라미터
| Name | Type | Description |
|---|---|---|
spec | object | 렌더링할 ADVN spec object 입니다. |
options | object | 선택적인 output-side time 설정입니다. |
옵션 필드
| Option | Type | Default | Description |
|---|---|---|---|
timeformat | string | rfc3339 | ECharts 로 time value 를 인코딩할 때 사용할 출력 시간 표현입니다. |
tz | string | local timezone | RFC3339 시간값을 렌더링할 때 적용할 timezone 입니다. |
사용 예시
| |
toTUILines()
첫 번째 sparkline-compatible series 를 terminal 친화적인 sparkline line 배열로 변환합니다.
사용 형식
toTUILines(spec[, options])파라미터
| Name | Type | Description |
|---|---|---|
spec | object | 렌더링할 ADVN spec object 입니다. |
options | object | 선택적인 sparkline 렌더링 설정입니다. |
옵션 필드
| Option | Type | Default | Description |
|---|---|---|---|
height | integer | 3 | raw-point 및 time-bucket-value line 출력에 사용할 차트 높이입니다. |
width | integer | 40 | 값을 sampling 하고 sparkline 본문을 렌더링할 때 사용할 폭입니다. |
seriesId | string | 첫 번째 compatible series | series[].id 로 렌더링할 series 를 선택합니다. |
timeformat | string | rfc3339 | sparkline x-axis label 에 사용할 출력 시간 형식입니다. |
tz | string | local timezone | sparkline x-axis label 에 적용할 timezone 입니다. |
참고:
seriesId를 주지 않으면toTUILines()는 첫 번째 sparkline-compatible series 를 반환합니다.seriesId를 주면 해당series[].id와 일치하는 series 를 렌더링합니다.- 선택 가능한 series id 를 미리 확인하려면
listSeries()를 사용하십시오. seriesId가 없거나 sparkline-compatible 하지 않은 series 를 가리키면 오류가 발생합니다.- 반환 값은 multi-line TUI chart 를 구성하는 terminal 친화적인 line 배열입니다.
toTUIBlocks()와 달리 axis label 을 포함한 확장된 multi-line chart 형태를 유지합니다.height는raw-point,time-bucket-value출력에만 적용됩니다.time-bucket-band는 기존max/avg/min형식을 유지합니다.toTUILines()는 현재rows,compactoption 을 받아도 사용하지 않습니다.
사용 예시
| |
CLI 예시:
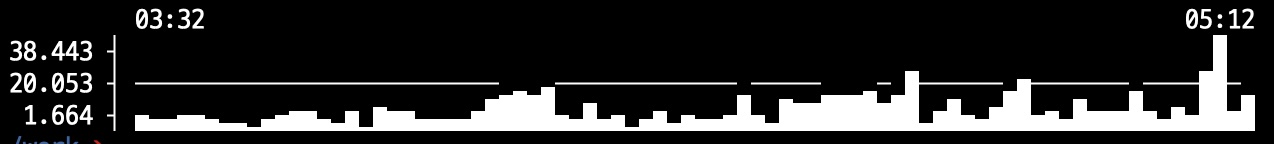
viz lines --height 5 --series series-1 sample.jsonFull source code:
| |
출력 예:
toTUIBlocks()
spec 을 terminal inspection 용 TUI block object 배열로 변환합니다.
사용 형식
toTUIBlocks(spec[, options])파라미터
| Name | Type | Description |
|---|---|---|
spec | object | 렌더링할 ADVN spec object 입니다. |
options | object | 선택적인 TUI 렌더링 설정입니다. |
옵션 필드
| Option | Type | Default | Description |
|---|---|---|---|
width | integer | 40 | sparkline, histogram, timeline 렌더링 폭입니다. |
rows | integer | 8 | table, histogram, event block 에서 보여줄 detail row 최대 개수입니다. |
compact | boolean | false | series summary 와 raw data table block 을 숨깁니다. |
timeformat | string | rfc3339 | 출력 시간 형식입니다. 값은 rfc3339, s, ms, us, ns 를 사용할 수 있습니다. |
tz | string | local timezone | 출력 시간값에 적용할 timezone 입니다. |
반환 값
반환 값은 block object 배열입니다. 각 block 은 공통적으로 다음 필드를 가질 수 있습니다.
| Field | Type | Description |
|---|---|---|
type | string | block 종류입니다. 예: summary, series-summary, sparkline, bandline, bars, box-summary, event-list, timeline, table, annotations. |
title | string | block 제목입니다. |
stats | array | summary 계열 block 에서 사용하는 { label, value } object 배열입니다. |
lines | array | sparkline, timeline, histogram 같은 line-oriented block 에서 사용하는 문자열 배열입니다. 현재 sparkline block 은 compact sparkline 한 줄을 반환합니다. |
columns | array | table block 의 column 이름 배열입니다. |
rows | array | table block 의 row 배열입니다. 각 row 는 column 순서에 맞는 value 배열입니다. |
meta | object | block 별 부가 정보입니다. 예: representation, axis, totalRows, truncated. |
type 에 따라 실제로 채워지는 필드는 다를 수 있습니다. 예를 들어 sparkline block 은 주로 lines 를 사용하고, table block 은 columns, rows, meta 를 사용합니다.
참고:
toTUIBlocks()의sparklineblock 은 원래의 compact sparkline 표현을 반환합니다.- axis label 과 여러 chart row 를 포함한 확장 형태가 필요하면
toTUILines()를 사용하십시오.
사용 예시
| |
toSVG()
spec 을 SVG 문자열로 변환합니다.
사용 형식
toSVG(spec[, options])파라미터
| Name | Type | Description |
|---|---|---|
spec | object | 렌더링할 ADVN spec object 입니다. |
options | object | 선택적인 SVG 렌더링 설정입니다. |
옵션 필드
| Option | Type | Default | Description |
|---|---|---|---|
width | integer | 960 | SVG canvas 너비 픽셀값입니다. |
height | integer | 420 | SVG canvas 높이 픽셀값입니다. |
padding | integer | 48 | 차트 바깥 여백 픽셀값입니다. |
background | string | white | SVG 배경색입니다. |
fontFamily | string | sans-serif | 기본 font family 입니다. |
fontSize | integer | 12 | 기본 font 크기 픽셀값입니다. |
showLegend | boolean | true | legend 렌더링 여부를 제어합니다. |
title | string | empty | 선택적인 차트 제목입니다. |
timeformat | string | rfc3339 | axis label 및 출력 시간값에 사용할 시간 형식입니다. |
tz | string | local timezone | RFC3339 시간 렌더링에 적용할 timezone 입니다. |
사용 예시
| |
toPNG()
spec 을 PNG binary data 로 변환합니다. 반환 값은 ArrayBuffer 이며, 필요하면 new Uint8Array(png) 로 읽을 수 있습니다.
사용 형식
toPNG(spec[, options])파라미터
| Name | Type | Description |
|---|---|---|
spec | object | 렌더링할 ADVN spec object 입니다. |
options | object | 선택적인 chart layout / text / time 출력 / rasterization 통합 설정입니다. |
옵션 필드
레이아웃 및 텍스트 필드:
| Option | Type | Default | Description |
|---|---|---|---|
width | integer | 960 | raster scaling 이전 출력 너비 픽셀값입니다. |
height | integer | 420 | raster scaling 이전 출력 높이 픽셀값입니다. |
padding | integer | 48 | 차트 바깥 여백 픽셀값입니다. |
background | string | white | SVG 레이아웃과 PNG raster 출력에 함께 적용할 배경색입니다. |
fontFamily | string | sans-serif | 기본 font family 입니다. |
fontSize | integer | 12 | 기본 font 크기 픽셀값입니다. |
showLegend | boolean | true | legend 렌더링 여부를 제어합니다. |
title | string | empty | 선택적인 차트 제목입니다. |
timeformat | string | rfc3339 | axis label 및 출력 시간값에 사용할 시간 형식입니다. |
tz | string | local timezone | RFC3339 시간 렌더링에 적용할 timezone 입니다. |
rasterization 필드:
| Option | Type | Default | Description |
|---|---|---|---|
scale | number | 1 | SVG 기반 레이아웃을 배율로 확대해서 rasterize 합니다. |
dpi | integer | unset | scale 이 없을 때 사용할 target DPI 입니다. 내부적으로 dpi / 96 배율로 적용됩니다. |
theme | string | mrtg | PNG theme 이름입니다. 현재는 mrtg 만 지원합니다. |
참고:
scale과dpi를 함께 주면scale이 우선합니다.- 현재 PNG renderer 는 MRTG 스타일 output 을 생성합니다.
- JavaScript API 는 단일
optionsobject 를 받아 내부적으로 layout 필드와 rasterization 필드로 분리합니다. - 하위 호환을 위해 기존
toPNG(spec, svgOptions, pngOptions)호출 형태도 계속 지원합니다.
사용 예시
| |
시간 처리
epoch timestamp 를 s, ms, us, ns 형식으로 사용하면 값 자체가 UTC 기준 절대 시간을 나타내므로
입력 데이터에 timezone 을 따로 명시할 필요가 없습니다. timezone 은 원본 timestamp 에 붙이는 정보라기보다,
그 timestamp 를 사람이 읽는 문자열로 렌더링할 때 적용하는 출력 옵션으로 이해하면 됩니다.
특히 ns 는 값의 자릿수가 커서 JavaScript number 로 표현하면 정밀도가 손실될 수 있습니다.
예를 들어 1712102400000000000 같은 값은 IEEE 754 배정밀도 부동소수점의 안전한 정수 범위를 넘기므로,
nanosecond epoch 는 문자열로 전달하는 것을 권장합니다.
Machbase Neo timestamp 데이터에는 다음 조합을 권장합니다.
timeformat: vizspec.Timeformat.ns- JavaScript number 대신 문자열 timestamp 사용
예시:
const spec = vizspec.createSpec({
    domain: {
        kind: 'time',
        timeformat: vizspec.Timeformat.ns,
    },
    series: [vizspec.eventRangeSeries({
        id: 'maintenance',
        data: [['1712102400000000000', '1712102460000000000', 'maintenance']],
    })],
});
시간 렌더링
데이터 소스의 시간 인코딩과 출력 시점의 시간 표현은 서로 다른 관심사입니다.
domain.timeformat은 ADVN 문서 안의 timestamp 인코딩을 설명합니다.- adapter option 의
timeformat,tz는 그 timestamp 를 어떤 형식과 timezone 으로 렌더링할지 설명합니다.
adapter option 을 생략하면 vizspec adapter 는 기본적으로 rfc3339 와 local timezone 을 사용합니다.
예시:
const svg = vizspec.toSVG(spec, {
    title: 'CPU Usage',
    width: 960,
    height: 420,
    timeformat: vizspec.Timeformat.rfc3339,
    tz: 'Asia/Seoul',
});
같은 규칙이 toTUIBlocks() 와 toEChartsOption() 에도 적용됩니다.
viz 명령어 사용
생성한 스펙을 검증하려면 다음과 같이 실행합니다.
/work > viz validate cpu-usage.json
VALID version=1 series=1 annotations=1
터미널에서 확인하려면 다음과 같이 실행합니다.
/work > viz view cpu-usage.jsonSVG 로 내보내려면 다음과 같이 실행합니다.
/work > viz export --title "CPU Usage" --output cpu-usage.svg cpu-usage.json출력 시간 형식과 timezone 을 명시하려면 다음과 같이 실행합니다.
/work > viz view --timeformat rfc3339 --tz Asia/Seoul cpu-usage.json