TQL
TQL
센서에서 전송된 데이터를 원하는 형태로 읽고 변환하시거나, 데이터베이스에 저장된 값을 다른 시스템이 요구하는 형식으로 전달하시려면 전용 도구가 필요합니다. TQL은 이러한 데이터를 쉽고 유연하게 가공하실 수 있도록 제공되는 Machbase의 변환 언어입니다.
예제 ‘signal’ 데이터 생성
아래 예제들을 위해 먼저 샘플 데이터를 생성합니다.
FAKE(
  oscillator(
    freq(15, 1.0), freq(24, 1.5),
    range('now', '10s', '1ms')
  )
)
INSERT( 'time', 'value', table('example'), tag('signal') )
출력 형식과 무관하게 사용
| |
입력 소스와 무관하게 사용
| |
TQL의 목적은 데이터를 손쉽게 변환하는 것입니다. 추가 애플리케이션 개발 없이도 다양한 형태로 데이터를 가공할 수 있는 방법을 이 장에서 소개합니다.
N:M 변환
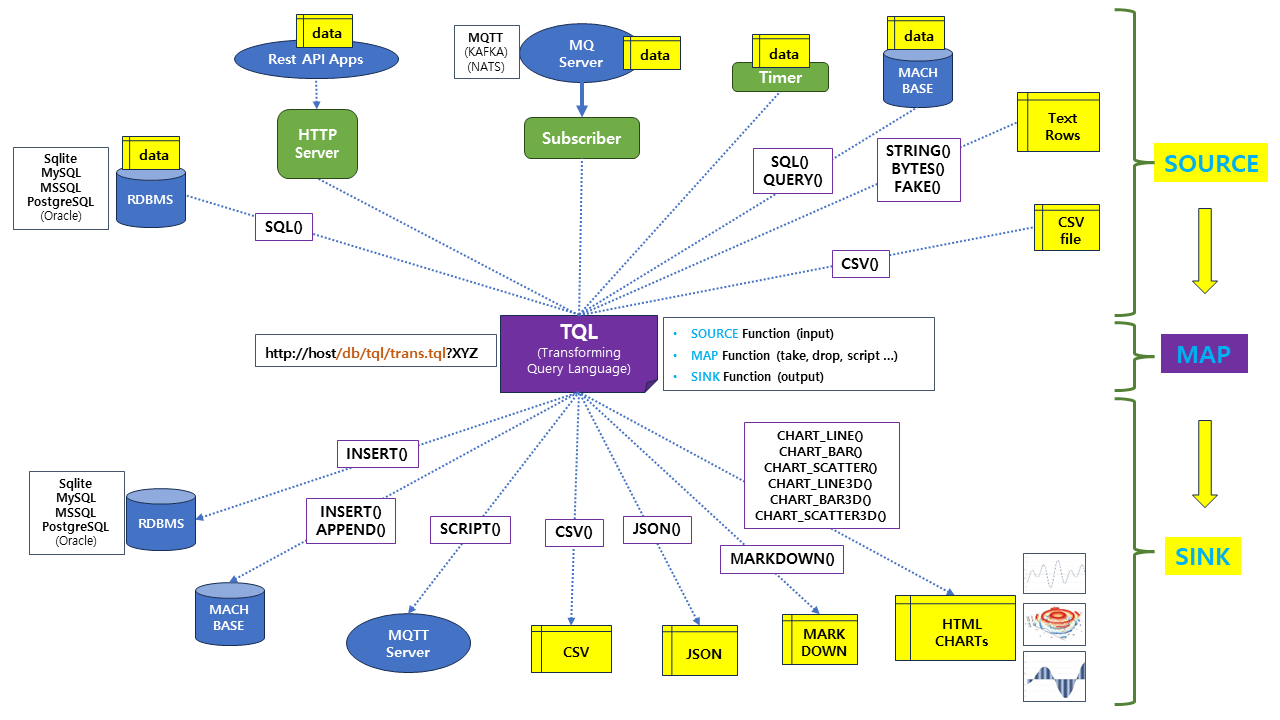
TQL Concept
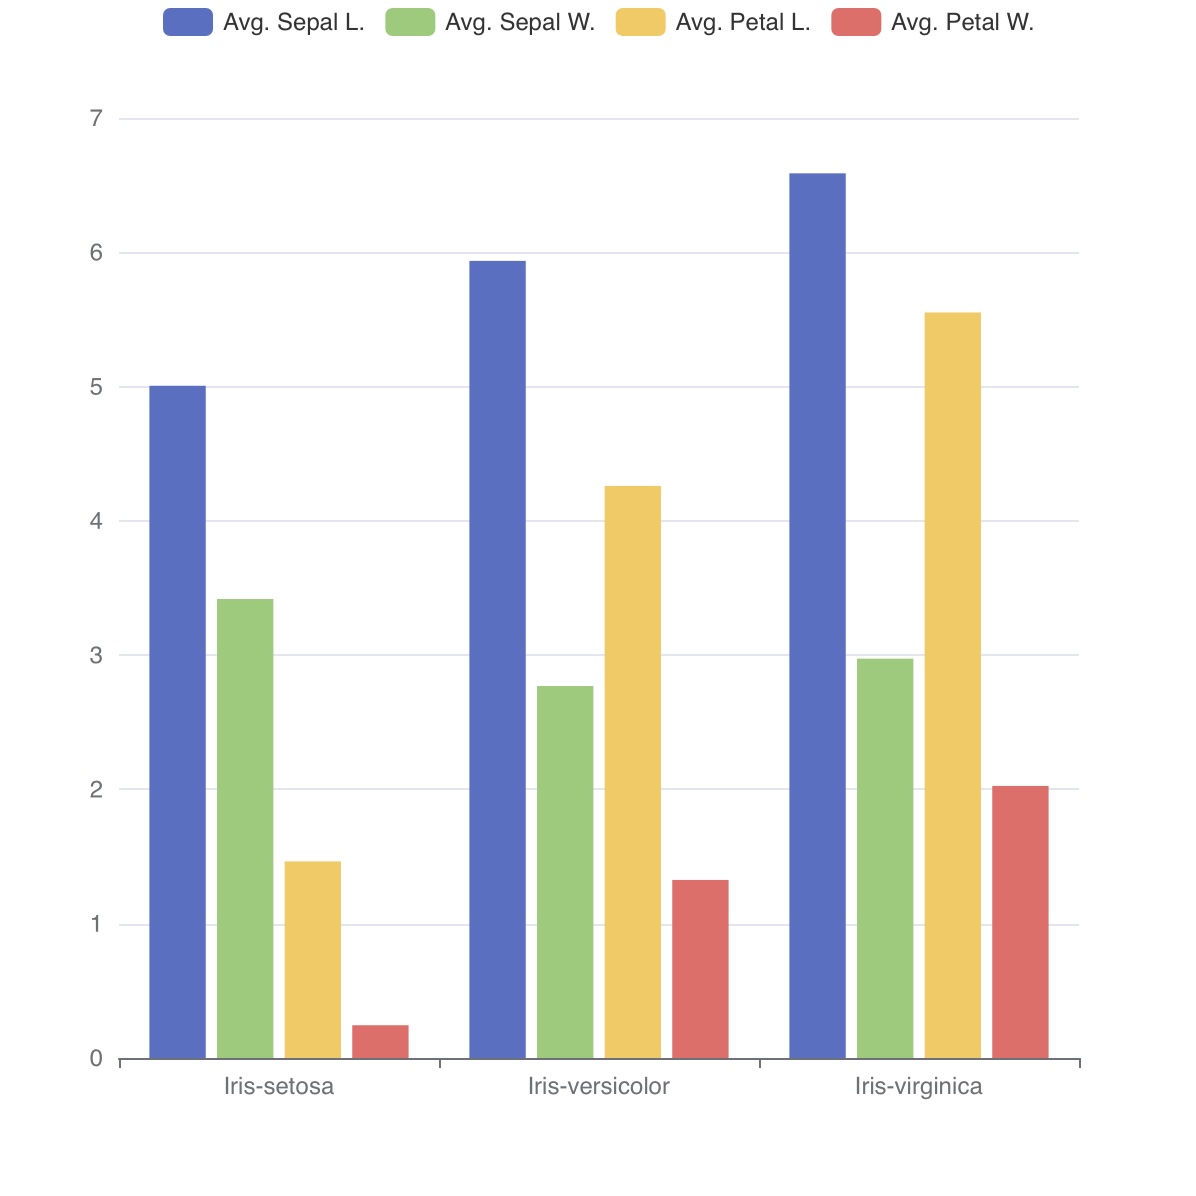
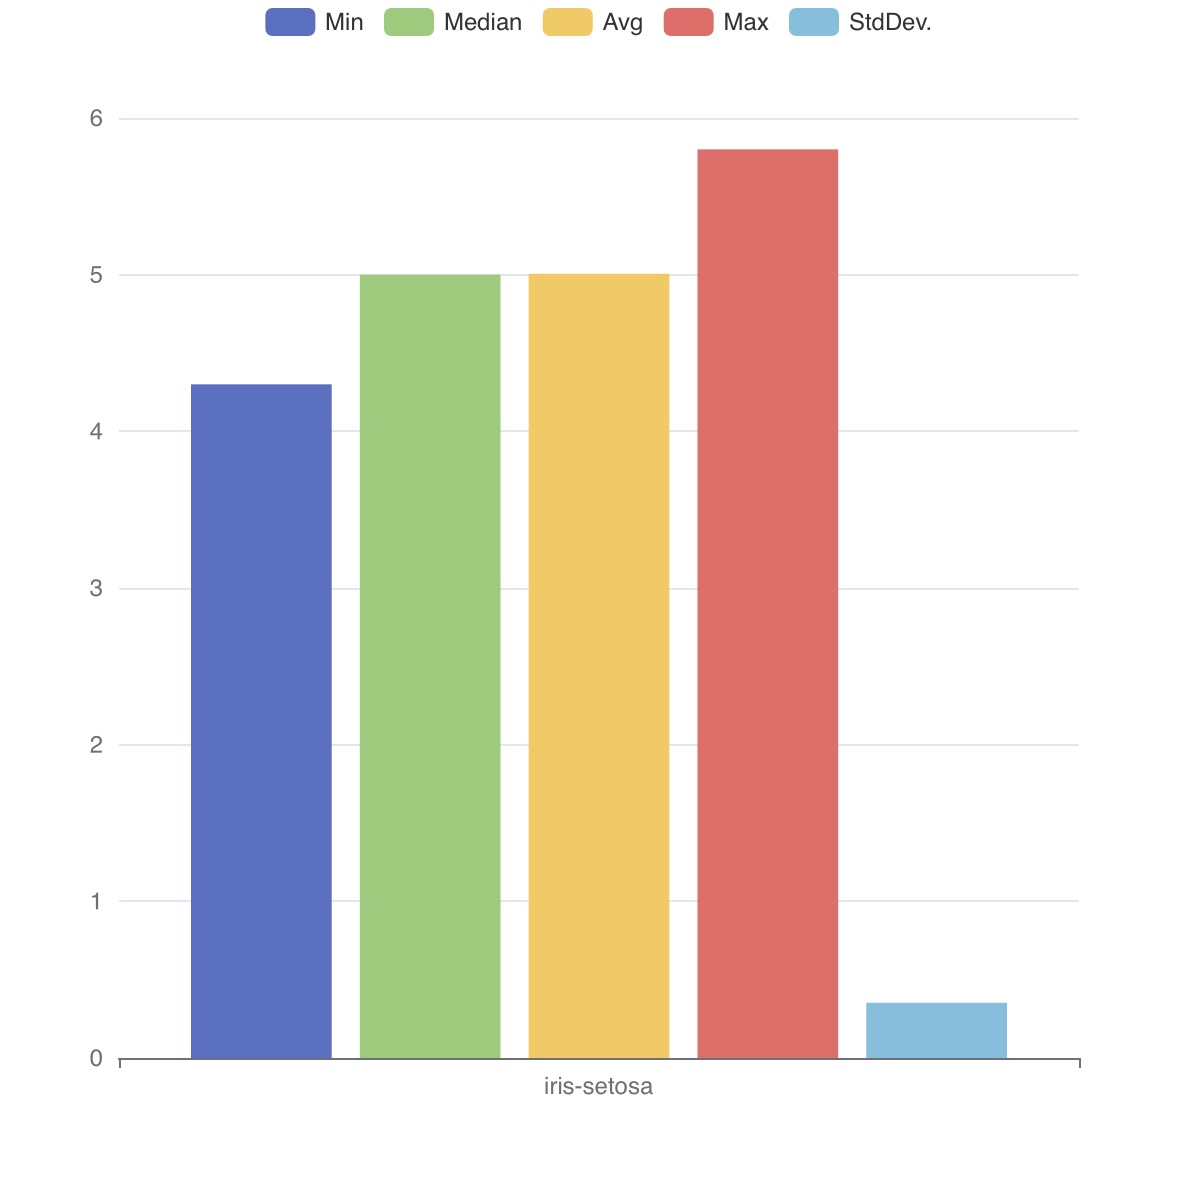
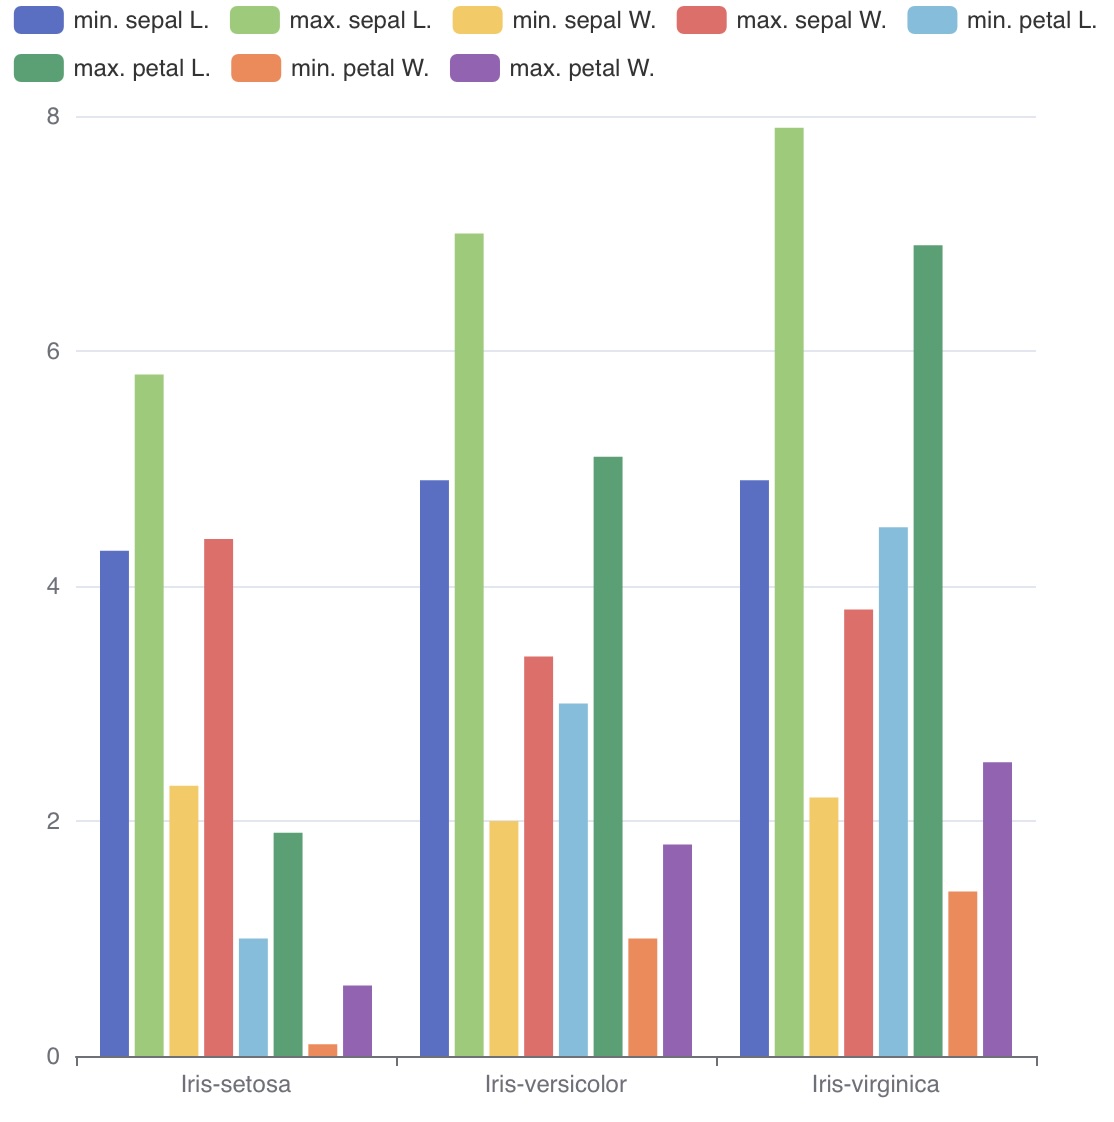
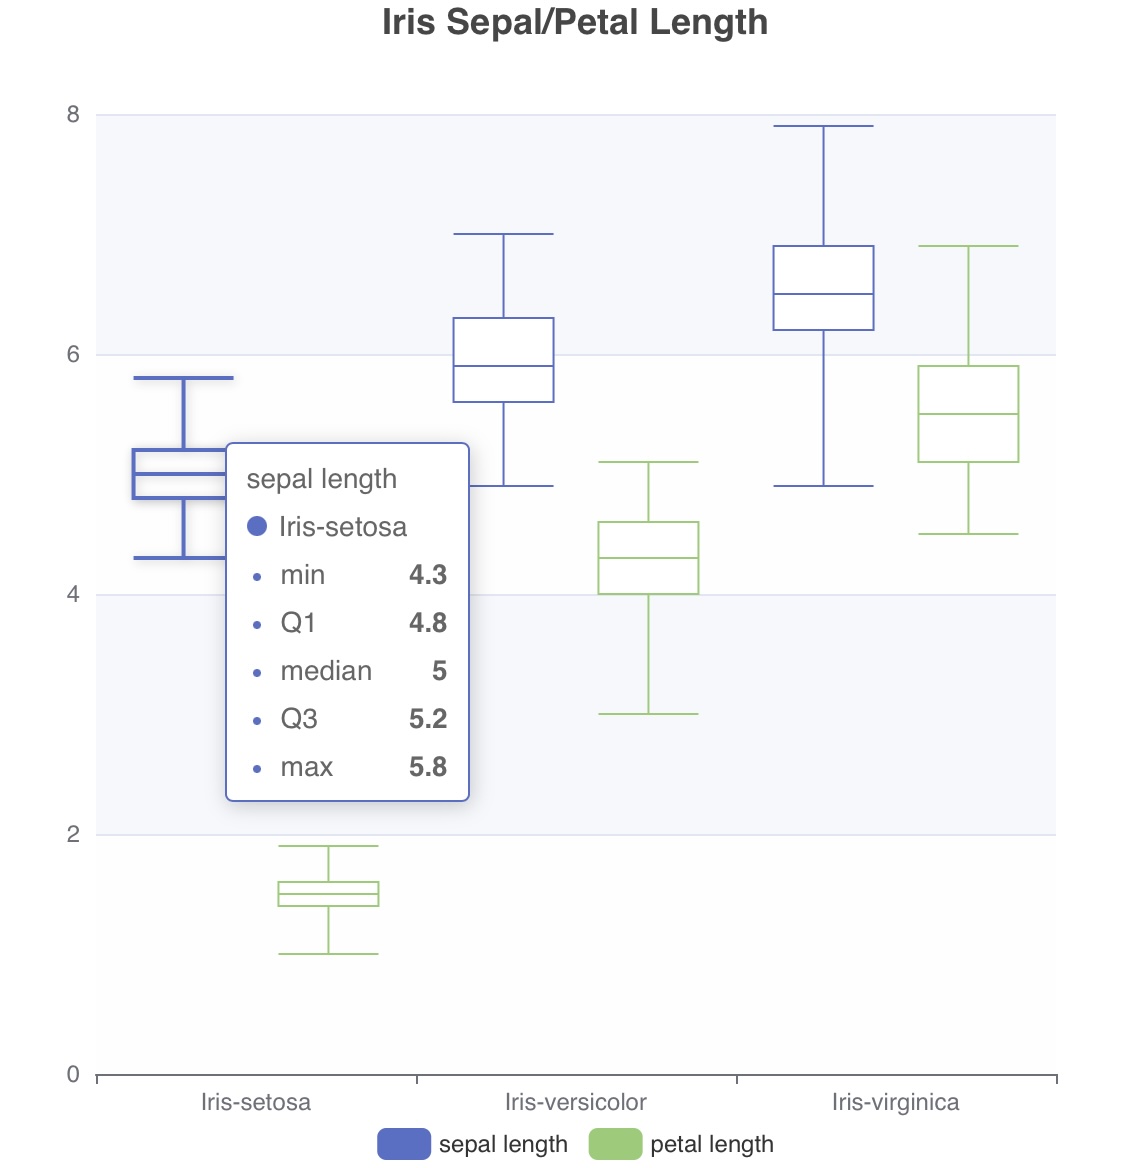
Iris
아래 Iris 데이터 예제를 통해 TQL이 어떤 용도로 사용되는지 간단히 살펴볼 수 있습니다.
- 클래스별 평균값
| |
이 장에서 다루는 내용
최근 업데이트