Skip to content

GEOMAP()

Since v8.0.44

구문: GEOMAP( [geomapID()] [, tileTemplate()] [, size()] )

GEOMAP은 제공된 좌표를 기반으로 지도 위에 마커와 도형을 렌더링합니다.
CHART와 유사하지만 스칼라 값 대신 좌표를 사용하며, 지원 좌표계는 WGS84입니다.

입력 데이터는 JavaScript 객체 형태여야 하며, 각 객체는 type, coordinates 필드를 포함하고 properties 필드는 선택 사항입니다.
type에 따라 지도 위에 레이어가 렌더링됩니다. 예를 들어 type: "circle"이면 해당 좌표에 원을 표시합니다.

tileTemplate()

구문: tileTemplate(url_template)

타일 서버 URL 템플릿을 지정합니다. 기본값은 https://tile.openstreetmap.org/{z}/{x}/{y}.png 입니다.

중요: 사내 방화벽 또는 보안 정책으로 기본 타일 서버에 접근할 수 없는 경우, 내부에 타일 서버를 구성하고 tileTemplate()으로 URL을 설정해야 합니다.
타일 서버 구축 방법은 본 문서 범위를 벗어납니다. 자세한 내용은 https://wiki.openstreetmap.org/wiki/Tile_servers 를 참고해 주십시오.

tileGrayscale()

구문: tileGrayscale(scale)

  • scale float: 타일 이미지를 흑백으로 표시할 때 사용할 값(0 ≤ scale ≤ 1.0, 기본값 0)

geomapID()

구문: geomapID(id)

자동으로 생성되는 ID 대신 사용할 지도의 ID(문자열)를 지정합니다.

size()

구문: size(width, height)

  • width string: 지도 너비(예: '800px')
  • height string: 지도 높이(예: '600px')

레이어

레이어는 지도 상에 표시되는 마커와 도형입니다.
GEOMAP() 입력은 JavaScript 객체로 표현된 딕셔너리 구조여야 하며, type, coordinates 필드는 필수, properties는 선택입니다.

형식

{
    type: "circle", // marker, circleMarker, polyline 등
    coordinates: [Lat, Lon],
    properties: {
        radius: Radius,
        color: "#FF0000",
        weight: 1
    }
}
이름타입설명
typeString레이어 종류 (예: marker, circle, circleMarker 등)
coordinates[]Float, [][]Float위도·경도 배열
propertiesDictionary레이어 종류에 따라 달라지는 옵션. Properties 참고

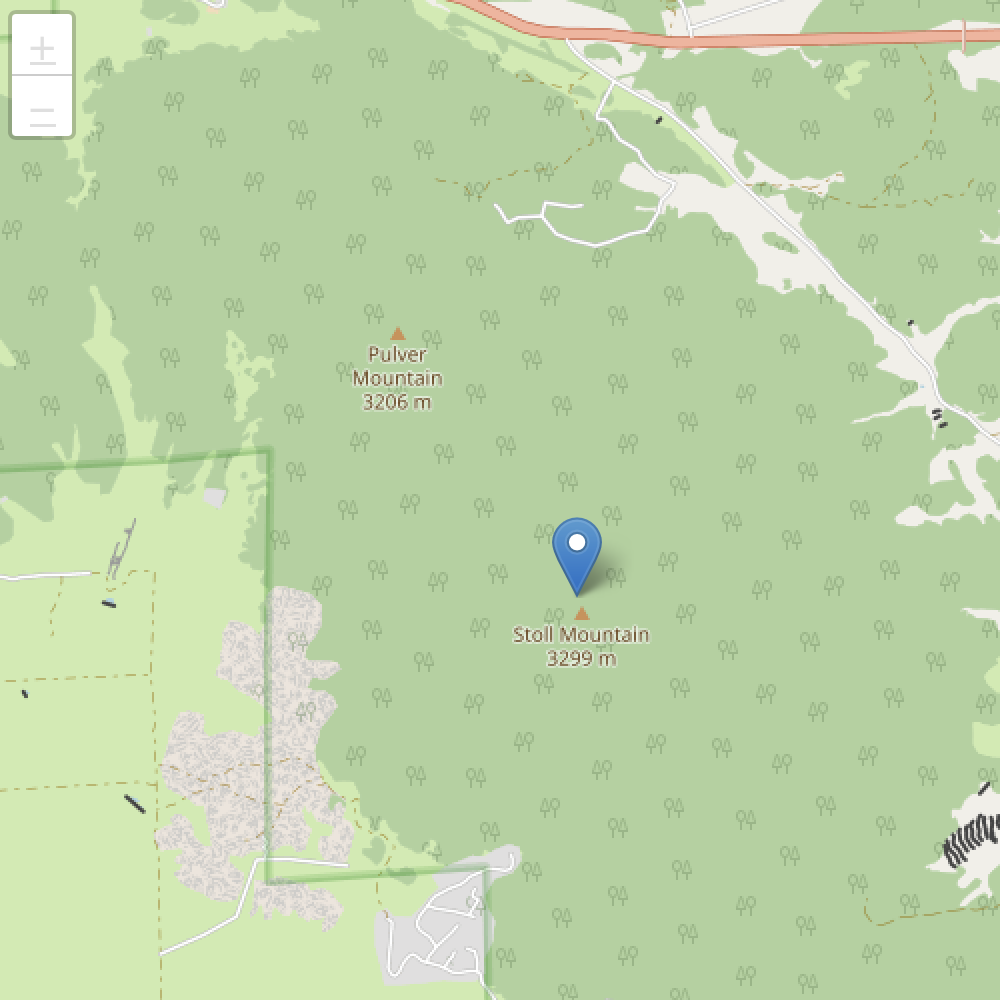
marker

 1
 2
 3
 4
 5
 6
 7
 8
 9
10
11
12
13
14
FAKE(json({
    [38.9934, -105.5018]
}))

SCRIPT({
    var lat = $.values[0];
    var lon = $.values[1];
    $.yield({
        type: "marker",
        coordinates: [lat, lon]
    });
})

GEOMAP()

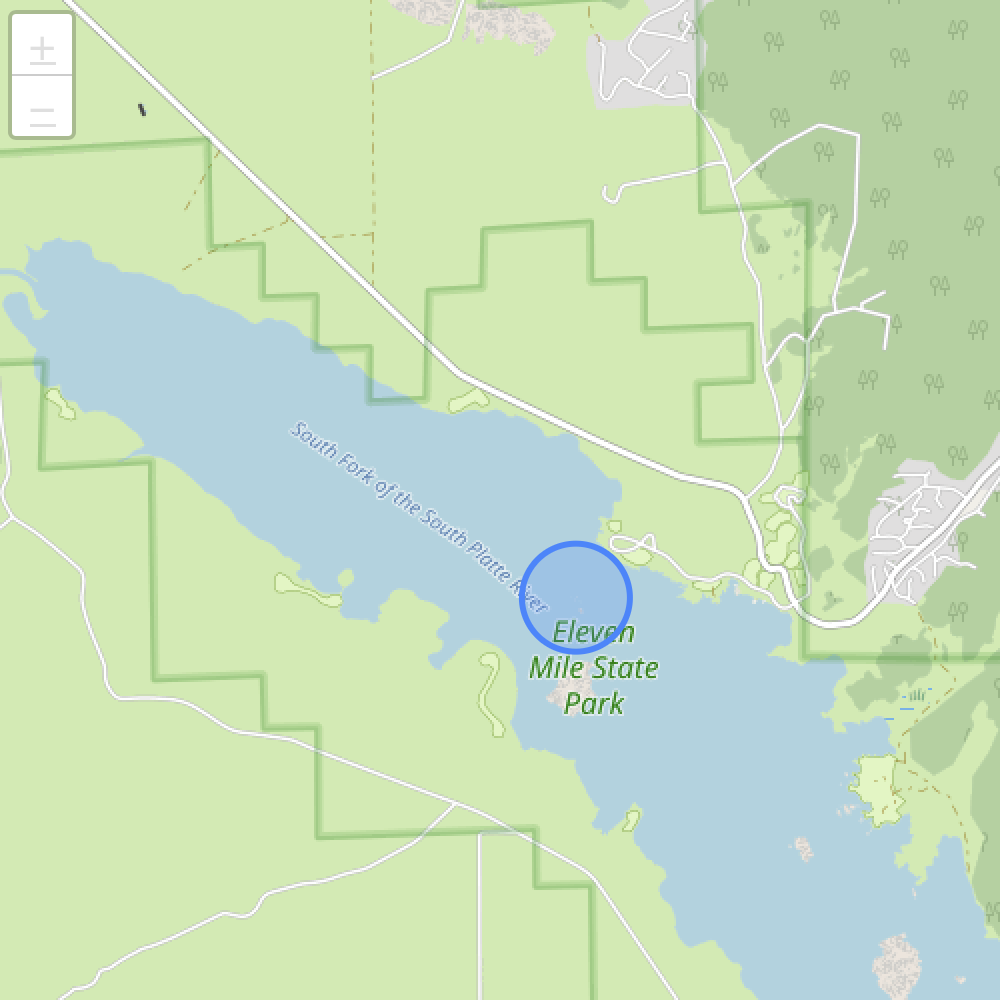
circleMarker

속성

속성기본값설명
radius10픽셀 단위 반지름
 1
 2
 3
 4
 5
 6
 7
 8
 9
10
11
12
13
14
15
16
17
FAKE(json({
    [38.935, -105.520]
}))

SCRIPT({
    var lat = $.values[0];
    var lon = $.values[1];
    $.yield({
        type: "circleMarker",
        coordinates: [lat, lon],
        properties:{
            radius: 40
        }
    });
})

GEOMAP()

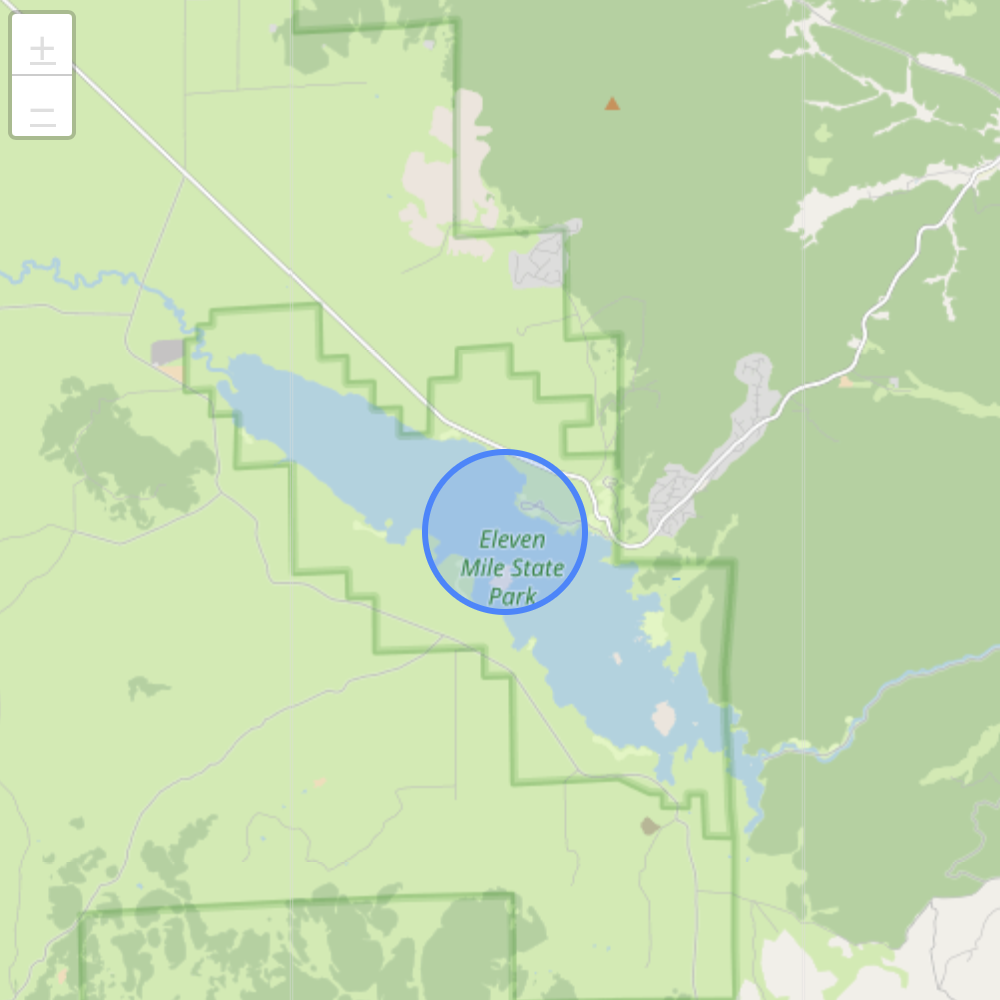
circle

속성

속성기본값설명
radius10미터 단위 반지름
 1
 2
 3
 4
 5
 6
 7
 8
 9
10
11
12
13
14
15
16
17
FAKE(json({
    [38.935, -105.520]
}))

SCRIPT({
    var lat = $.values[0];
    var lon = $.values[1];
    $.yield({
        type: "circle",
        coordinates: [lat, lon],
        properties:{
            radius: 400
        }
    });
})

GEOMAP()

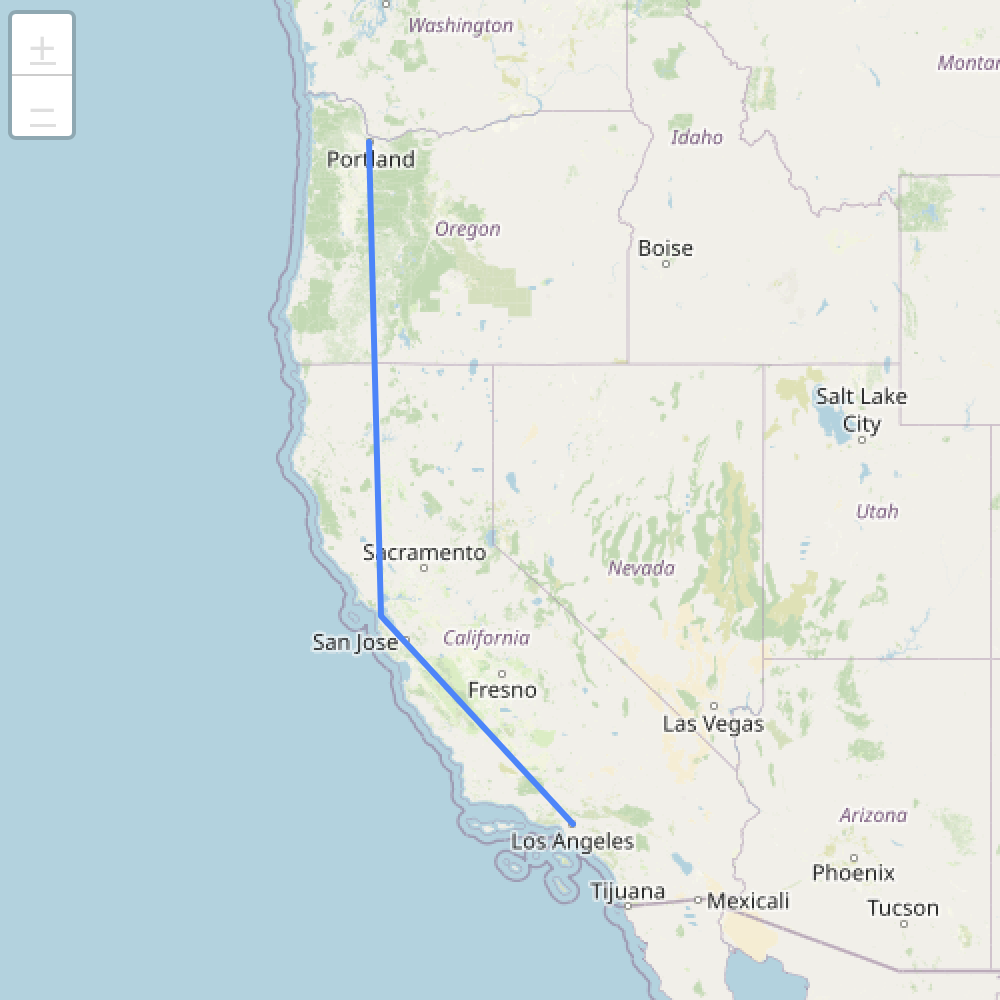
polyline

FAKE(json({
    [45.51, -122.68],
    [37.77, -122.43],
    [34.04, -118.2]
}))

SCRIPT({
    var points = [];
    function finalize() {
        $.yield({
            type: "polyline",
            coordinates: points
        });
    }
},{
    var lat = $.values[0];
    var lon = $.values[1];
    points.push( [lat, lon] );
})

GEOMAP()
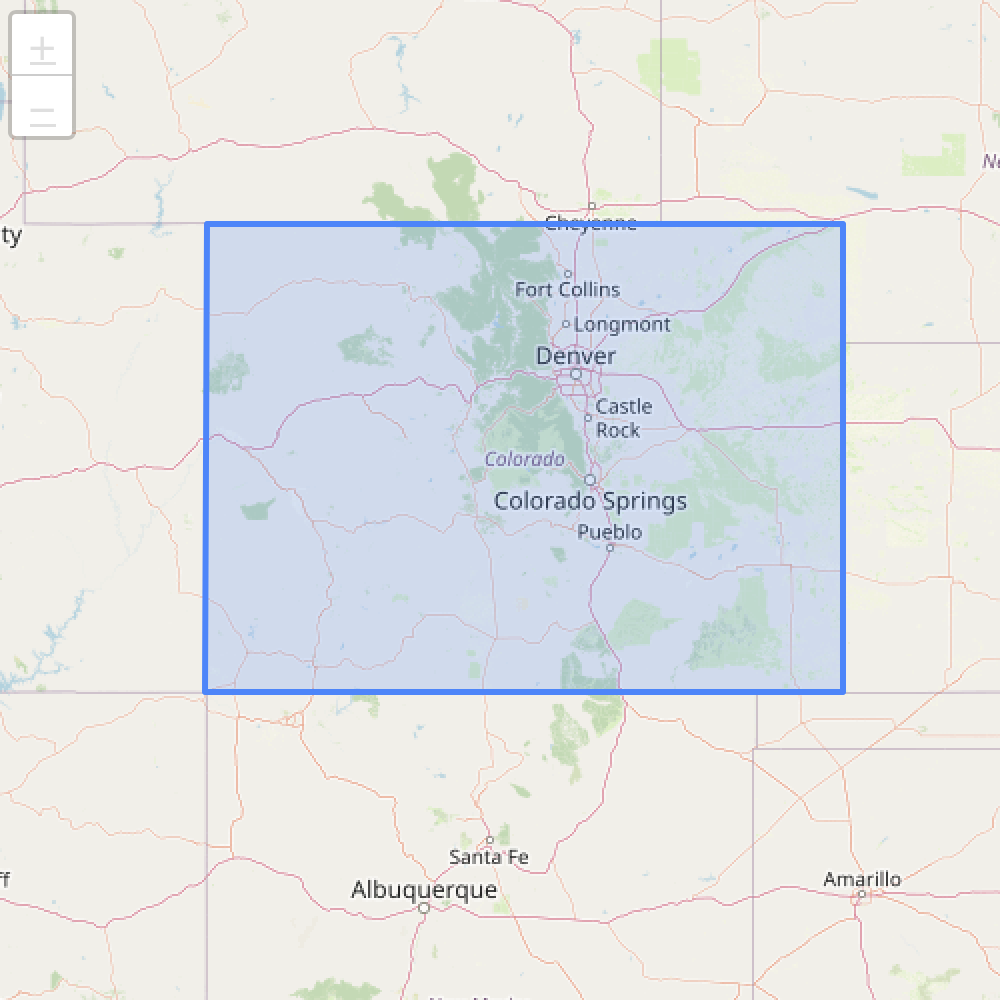
polygon

FAKE(json({
    [37, -109.05],
    [41, -109.03],
    [41, -102.05],
    [37, -102.05]
}))

SCRIPT({
    var points = [];
    function finalize() {
        $.yield({
            type: "polygon",
            coordinates: points
        });
    }
},{
    var lat = $.values[0];
    var lon = $.values[1];
    points.push( [lat, lon] );
})

GEOMAP()
Properties

레이어 공통 속성

속성타입기본값설명
strokeBooleantrue외곽선을 그릴지 여부
colorString'#3388ff'외곽선 색상
weightNumber3외곽선 두께(px)
opacityNumber1.0레이어 투명도
fillColorString채우기 색상(미지정 시 color와 동일)
fillOpacityNumber0.2채우기 투명도
popupObjectnullPopup 참조
tooltipObjectnullTooltip 참조

Popup

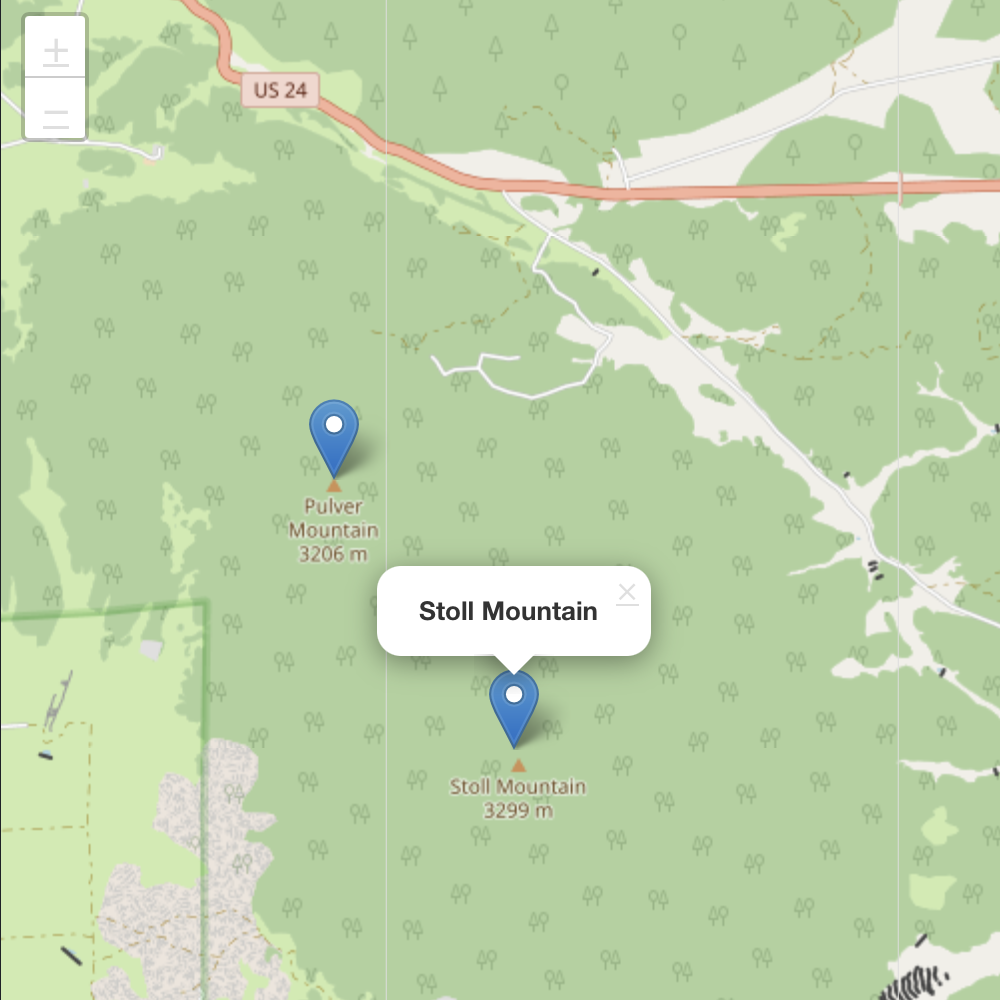
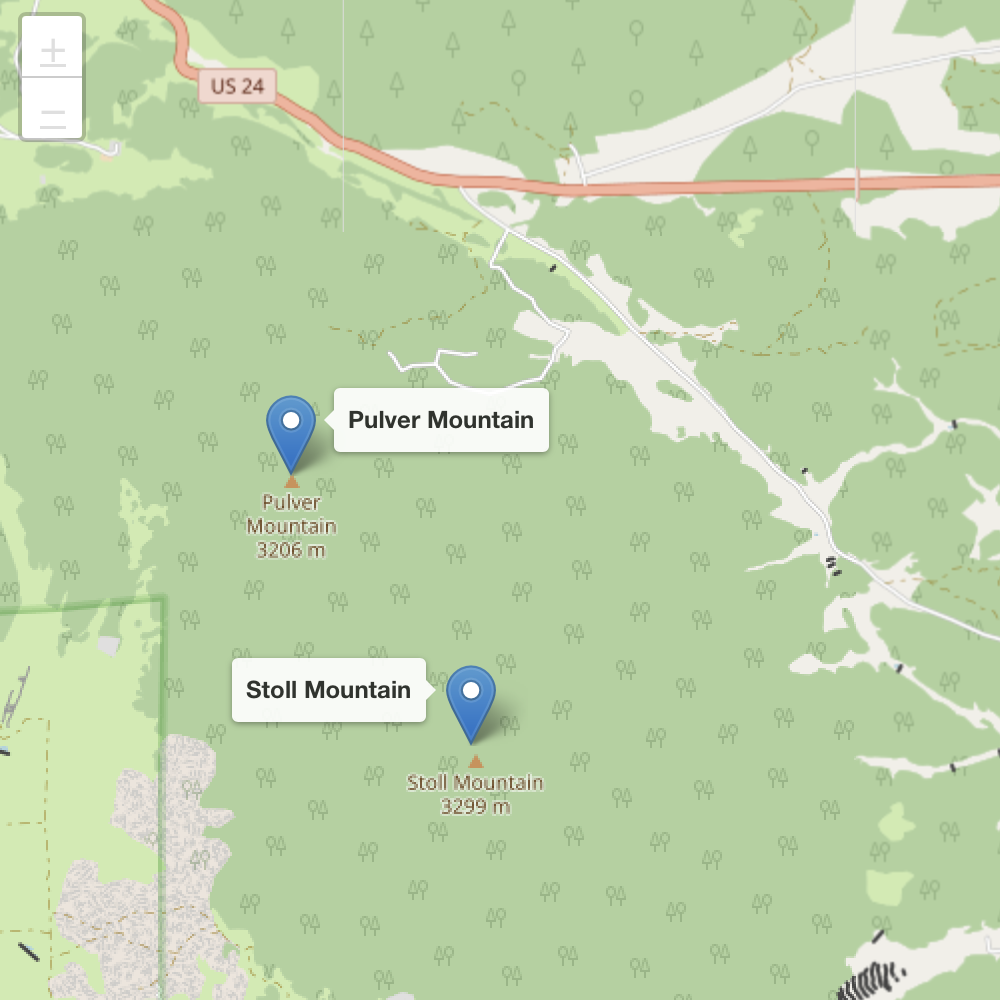
레이어의 propertiespopup 객체를 지정하면 클릭 시 팝업 메시지를 표시합니다.

속성타입기본값설명
contentString텍스트/HTML 콘텐츠
openBooleanfalse초기 상태에서 팝업을 열지 여부
maxWidthNumber300팝업 최대 너비(px)
minWidthNumber50팝업 최소 너비(px)
 1
 2
 3
 4
 5
 6
 7
 8
 9
10
11
12
13
14
15
16
17
18
19
20
21
FAKE(json({
    ["Stoll Mountain", 38.9934, -105.5018],
    ["Pulver Mountain", 39.0115, -105.5173]
}))

SCRIPT({
    var name = $.values[0];
    var lat  = $.values[1];
    var lon  = $.values[2];
    $.yield({
        type: "marker",
        coordinates: [lat, lon],
        properties: {
            popup: {
                content: '<b>'+name+'</b>'
            }
        }
    });
})

GEOMAP()

Tooltip

Since v8.0.44

지도 레이어 위에 간단한 텍스트를 표시합니다.

속성타입기본값설명
contentString텍스트/HTML 콘텐츠
openBooleanfalse초기 상태에서 표시 여부
directionStringauto툴팁 방향(right, left, top, bottom, center, auto)
permanentBooleanfalse마우스오버 없이 항상 표시할지 여부
opacityNumber0.9툴팁 투명도
 1
 2
 3
 4
 5
 6
 7
 8
 9
10
11
12
13
14
15
16
17
18
19
20
21
FAKE(json({
    ["Stoll Mountain", 38.9934, -105.5018],
    ["Pulver Mountain", 39.0115, -105.5173]
}))
SCRIPT({
    var name = $.values[0];
    var lat  = $.values[1];
    var lon  = $.values[2];
    $.yield({
        type: "marker",
        coordinates: [lat, lon],
        properties: {
            tooltip: {
                content: '<b>'+name+'</b>',
                direction: "auto",
                permanent: true
            }
        }
    });
})
GEOMAP()

예제

CSV 파일에서 테스트 데이터를 불러와 “TRIP” 테이블에 입력합니다. 이 TQL은 지정된 URL에서 CSV 파일을 내려받아, CSV 문자열을 적절한 데이터 타입으로 변환한 뒤, TRIP 테이블에 레코드를 입력합니다.

 1
 2
 3
 4
 5
 6
 7
 8
 9
10
11
12
13
14
15
16
17
18
19
20
21
22
23
24
25
26
27
28
29
30
31
32
33
34
35
36
// CSV Format: TIME, LAT, LON
CSV(file("https://docs.machbase.com/assets/example/data-trajectory-firenze.csv"))
DROP(1) // skip header
SCRIPT({
    // create trip table, if not exists
    $.db().exec("CREATE TAG TABLE IF NOT EXISTS TRIP ("+
        "name varchar(100) primary key, "+
        "time datetime basetime, "+
        "value double summarized, "+
        "lat double, "+
        "lon double "+
    ")")
    // parse time form csv string '23-04-21 16:53:21:123000'
    function parseTime(str) { 
        y = "20"+str.substr(0,2);
        m = str.substr(3,2) - 1;
        d = str.substr(6,2);
        hours = str.substr(9, 2);
        mins = str.substr(12,2);
        secs = str.substr(15, 2);
        milli = str.substr(18, 3)
        var D = new Date(y, m, d, hours, mins, secs, milli);
        return (D.getFullYear() == y && D.getMonth() == m && D.getDate() == d) ? D : 'invalid date';
    }
}, {
    var ts = parseTime($.values[0]).getTime(); // epoch mills
    var lat = parseFloat($.values[1]);
    var lon = parseFloat($.values[2]);
    // yield name, time, value, lat, lon
    $.yield("firenze", ts, 0, lat, lon)
})
// epoch from milli to nano and to datetime type
MAPVALUE(1, time(value(1)*1000000))
// insert into trip table
SQL(`INSERT INTO TRIP (name, time, value, lat, lon) values(?,?,?,?,?)`, 
    value(0), value(1), value(2), value(3), value(4))

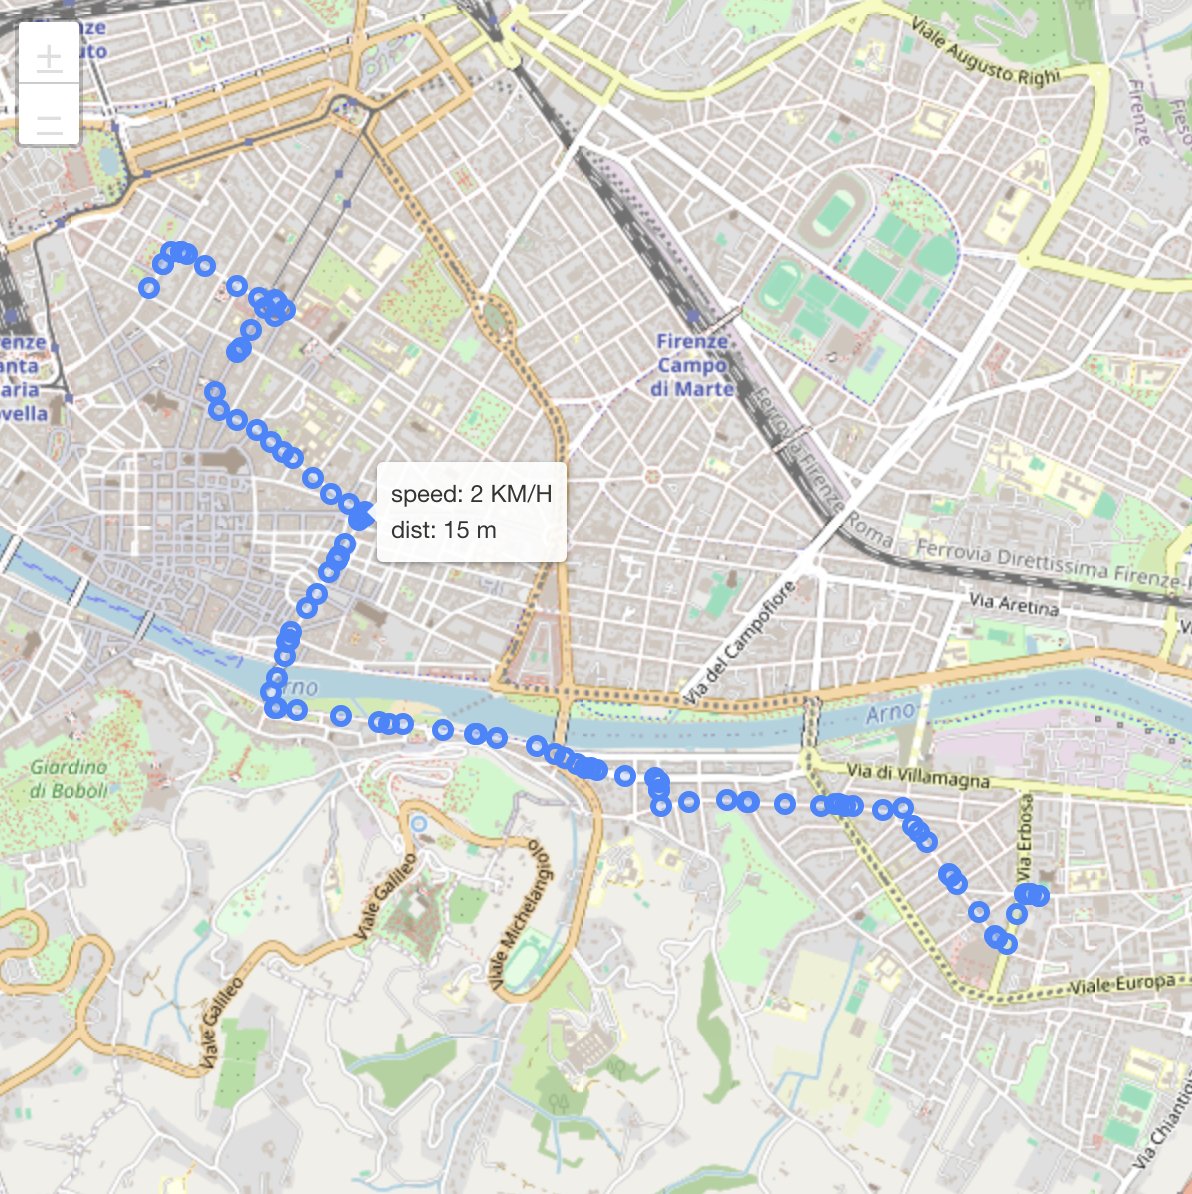
궤적

 1
 2
 3
 4
 5
 6
 7
 8
 9
10
11
12
13
14
15
16
17
18
19
SQL(`SELECT time, lat, lon FROM TRIP
     WHERE name = 'firenze' ORDER BY time`)
SCRIPT({
    // time to epoch nanos to Date (javascript)
    var timestamp = new Date($.values[0].unixNano()/1000000); 
    // coordinate [lat, lon]
    var coord = [$.values[1], $.values[2]]; 
    $.yield({
        type:"circle",
        coordinates: coord,
        properties: {
            radius: 15,
            tooltip: {
                content: ""+timestamp
            }
        }
    });
})
GEOMAP()

거리와 속도

Haversine 공식을 사용해 두 지점 사이의 이동 거리를 미터 단위로 계산하고, 두 지점의 시간 차이를 기준으로 이동 속도를 시속(km/h)으로 계산합니다.

 1
 2
 3
 4
 5
 6
 7
 8
 9
10
11
12
13
14
15
16
17
18
19
20
21
22
23
24
25
26
27
28
29
30
31
32
33
34
35
36
37
38
SQL(`SELECT time, lat, lon FROM TRIP
     WHERE name = 'firenze' ORDER BY time`)
// calculate the distance and speed
SCRIPT({
    var EarthRadius = 6378137.0; // meters
    function degreesToRadians(d) { return d * Math.PI / 180; }
    function distance(p1, p2) {  // haversine distance
        lat1 = degreesToRadians(p1[0]);
        lon1 = degreesToRadians(p1[1]);
        lat2 = degreesToRadians(p2[0]);
        lon2 = degreesToRadians(p2[1]);
        diffLat = lat2 - lat1;
        diffLon = lon2 - lon1;
        a = Math.pow(Math.sin(diffLat/2), 2) + Math.cos(lat1)*Math.cos(lat2)*Math.pow(Math.sin(diffLon/2), 2);
        c = 2 * Math.atan2(Math.sqrt(a), Math.sqrt(1-a));
        return c * EarthRadius;
    }
    var prevLoc, prevTs, dist;
},{
    var ts = $.values[0].unix(); // unix epoch sec.
    var coord = [$.values[1], $.values[2]];
    dist = prevLoc === undefined ? 0 : distance(prevLoc, coord);
    speed = prevTs === undefined ? 0 : dist*3.600 / (ts - prevTs);
    prevLoc = coord;
    prevTs = ts;
    $.yield({
        type:"circleMarker",
        coordinates: coord,
        properties: {
            radius: 4,
            tooltip: {
                content: "speed: "+speed.toFixed(0)+" KM/H<br/>"+
                         "dist: "+dist.toFixed(0)+" m",
            }
        }
    });
})
GEOMAP()
최근 업데이트