HTTP API 웹 앱
📌
예시를 진행하려면 미리
EXAMPLE 테이블을 생성해 두어야 합니다.CREATE TAG TABLE IF NOT EXISTS EXAMPLE (
NAME VARCHAR(20) PRIMARY KEY,
TIME DATETIME BASETIME,
VALUE DOUBLE SUMMARIZED
);HTML
simple-webapp.html 파일을 만들어 봅시다. machbase-neo는
Since v8.0.14
부터 .html, .js, .css 파일을 직접 편집할 수 있습니다.
이전 버전을 사용 중이라면 업데이트하거나 선호하는 편집기를 사용해 주십시오.
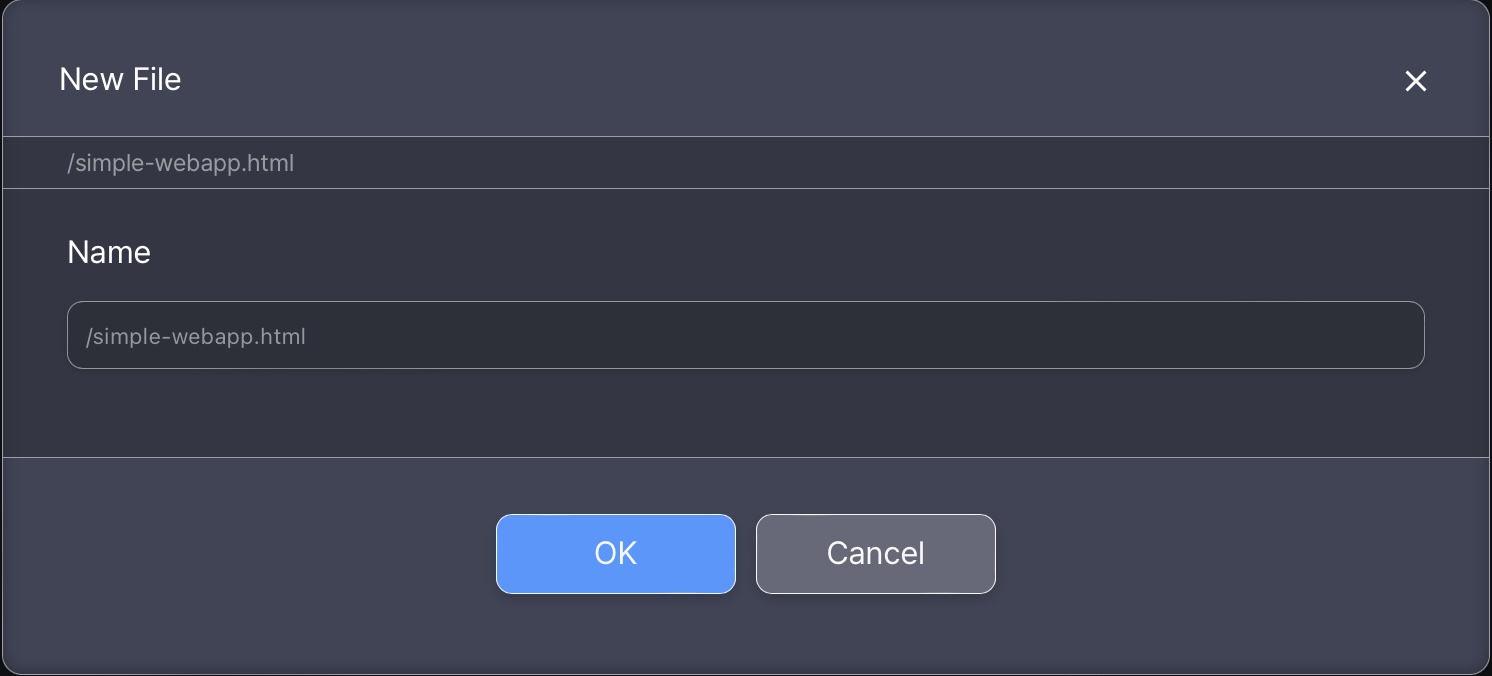
파일을 수정 후 저장하고, 편집기 좌측 상단의 ► 버튼을 클릭하면 브라우저에서 바로 열 수 있습니다.
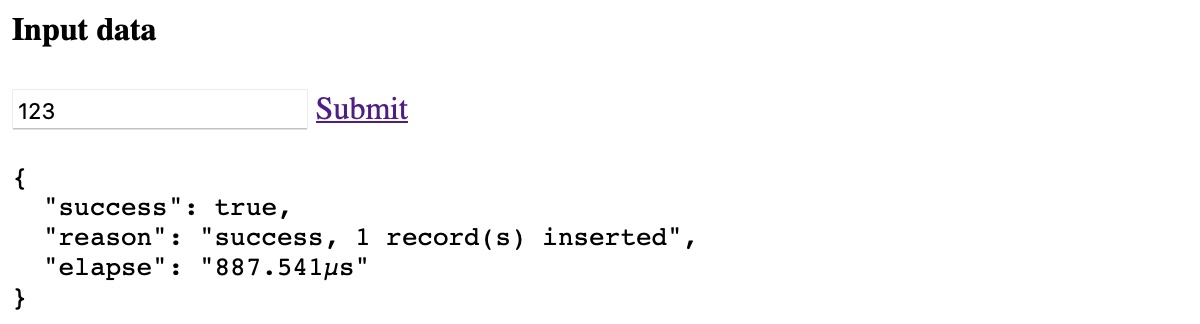
데이터 쓰기
아래 코드를 복사해 붙여 넣습니다.
| |
- 6행:
timeformat=ms는 전송하는 타임스탬프가 밀리초 단위 유닉스 에포크임을 나타냅니다. 15행의Date.now()와 연동됩니다. - 9행: 콘텐츠 타입을 지정해 machbase-neo가 페이로드 형식을 올바르게 해석하도록 합니다.
- 11~18행: 전송할 실제 데이터입니다. 예시는 1건이지만
rows배열에 여러 건을 담을 수 있습니다.
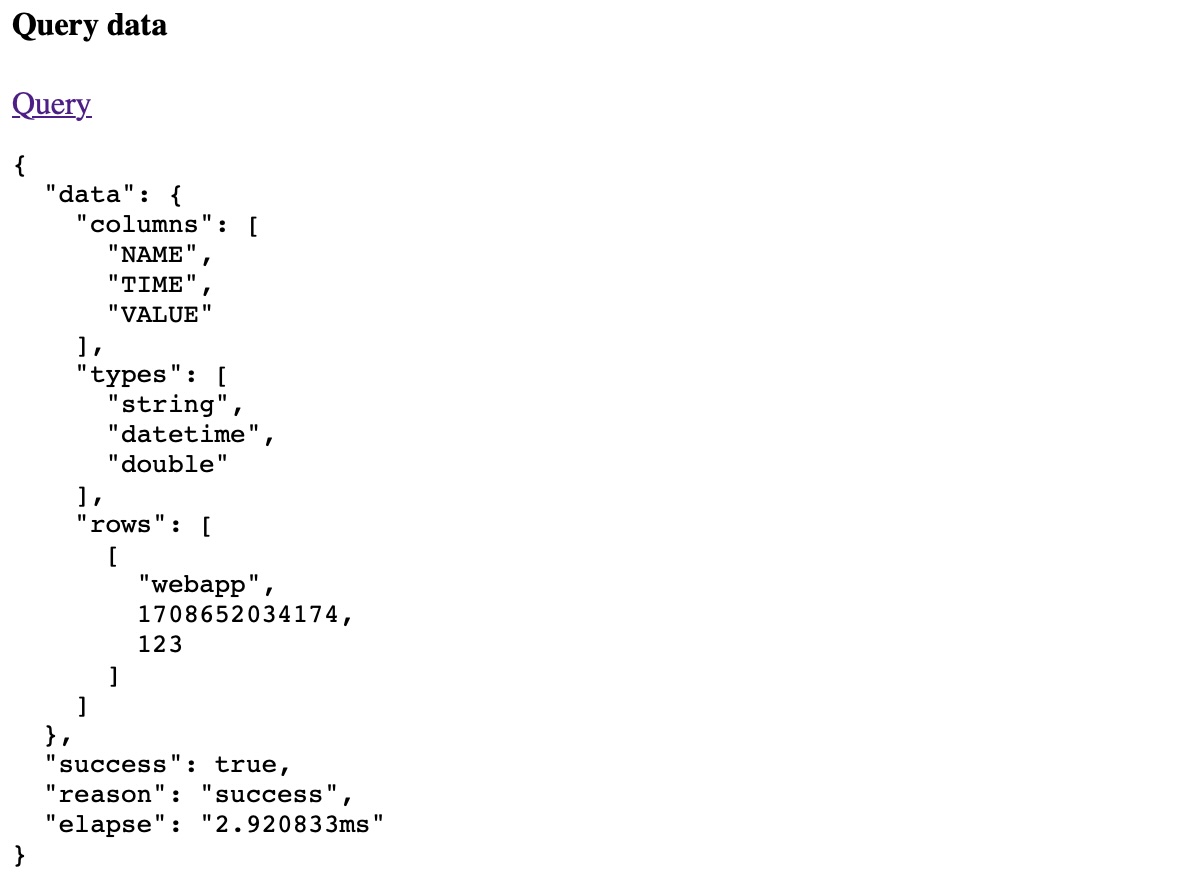
데이터 조회
simple-webapp.html에 데이터를 읽어오는 기능을 추가합니다. function queryData(){...}와 “Query” 액션을 더해 주세요.
| |
- 28행: 결과의 시간 형식을 밀리초 단위 유닉스 에포크로 지정합니다.
| |
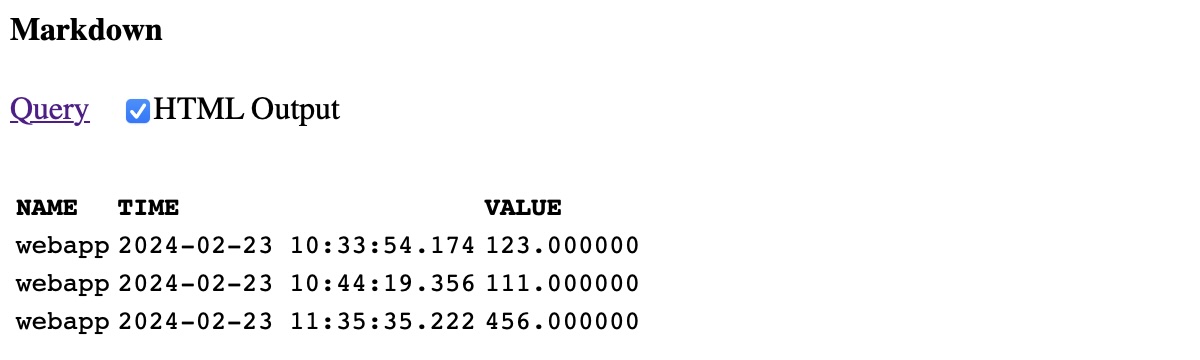
Markdown
쿼리 결과를 TQL을 이용해 마크다운으로 변환할 수 있습니다. function markdownData(){...}와 “Markdown” 버튼을 추가합니다.
| |
- 36행: 출력 형태를 HTML 또는 일반 마크다운으로 선택합니다.
- 40행:
MARKDOWN()TQL 싱크에html(boolean),timeformat(),tz()등의 옵션을 지정합니다.
| |
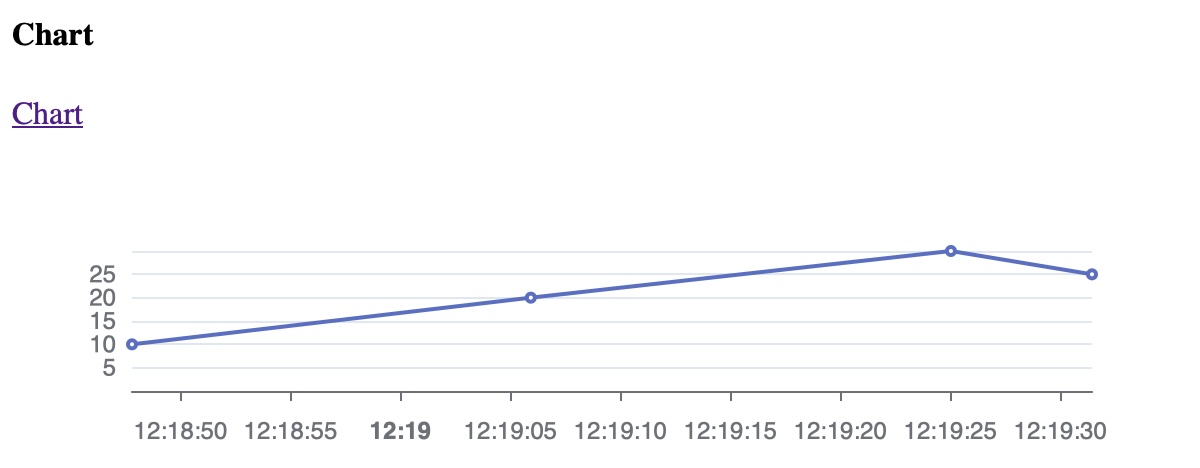
차트
HTTP API로 JSON 또는 CSV 데이터를 받아 선호하는 차트 라이브러리를 사용할 수도 있지만, TQL의 CHART() 싱크를 이용하면 간편하게 시각화할 수 있습니다.
추가 도구 없이 TQL만으로 데이터를 시각화하는 예시는 다음과 같습니다.
function chartData()와 보조 함수 function loadJS()를 추가합니다.
| |
또한 Apache ECharts 라이브러리를 추가합니다. machbase-neo에 기본 포함되어 있어 바로 사용할 수 있습니다.
| |
| |
전체 소스 코드
| |
최근 업데이트