랜덤 데이터를 활용한 웹 앱

랜덤 데이터를 활용한 웹 앱

📌
예시를 진행하려면 미리 EXAMPLE 테이블을 생성해 두어야 합니다.
CREATE TAG TABLE IF NOT EXISTS EXAMPLE  (
    NAME VARCHAR(20) PRIMARY KEY,
    TIME DATETIME BASETIME,
    VALUE DOUBLE SUMMARIZED
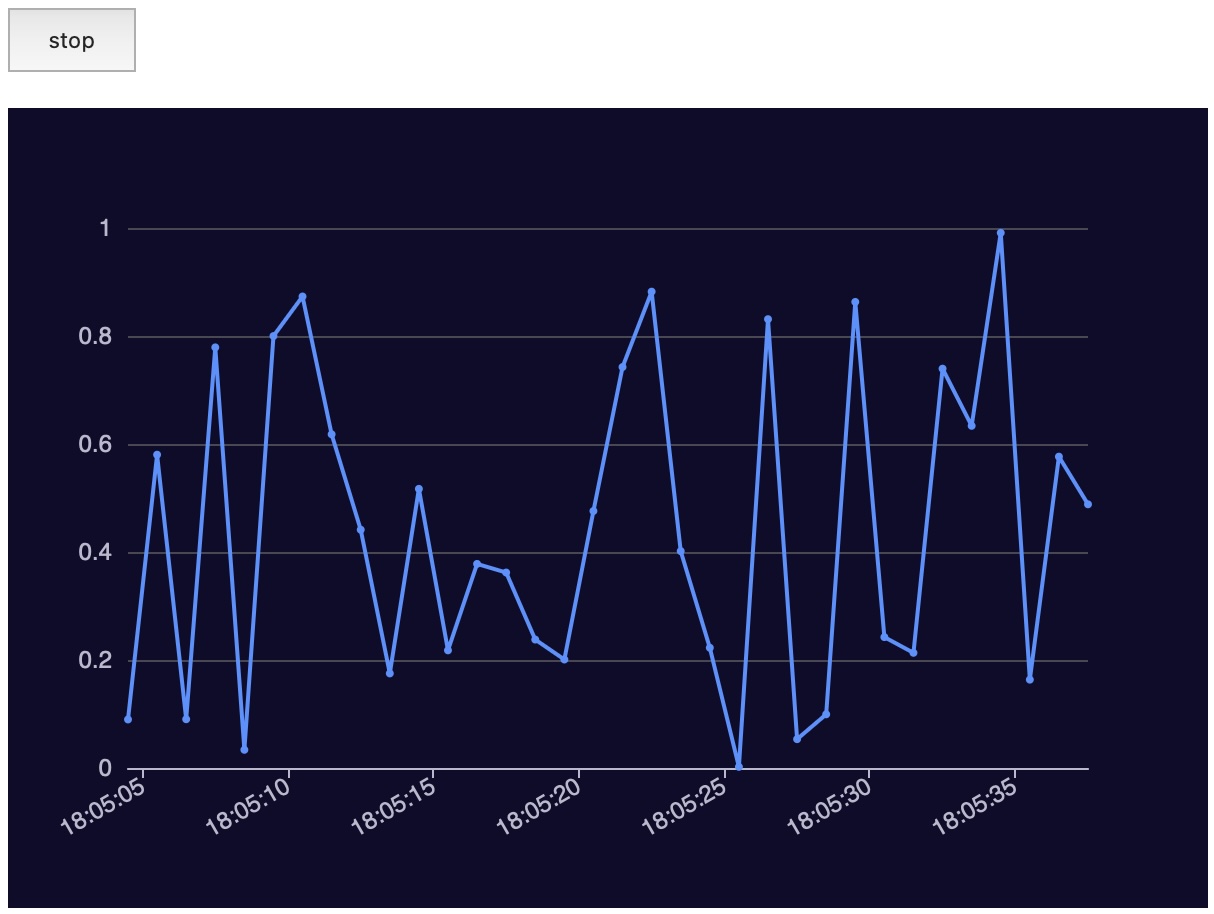
);

이 예시는 초마다 랜덤 데이터를 생성하고 차트를 자동으로 갱신합니다.

  • 11행: “start” 버튼을 누르면 타이머가 동작하며 EXAMPLE 테이블에 데이터를 기록합니다.
  • 13행: 페이로드는 CSV 형식입니다.
  • 37행: SQL_SELECT()CHART()를 조합해 차트를 그립니다.
 1
 2
 3
 4
 5
 6
 7
 8
 9
10
11
12
13
14
15
16
17
18
19
20
21
22
23
24
25
26
27
28
29
30
31
32
33
34
35
36
37
38
39
40
41
42
43
44
45
46
47
48
49
50
51
52
53
54
55
56
57
58
59
60
61
62
63
64
65
66
67
68
69
<html>
<head>
    <script>
        var timer
        function toggleTimer(){
            const btn = document.getElementById('btn')
            if (btn.value == 'start') {
                btn.value = 'stop'
                timer = setInterval(function(){
                    // insert new random value
                    fetch("http://127.0.0.1:5654/db/write/EXAMPLE?timeformat=ms", {
                        method: "POST",
                        headers: { "Content-Type": "text/csv" },
                        body: "webapp," + Date.now() + "," + Math.random()
                    });
                    // update chart
                    chartData();
                }, 1000)
            } else {
                btn.value = 'start'
                clearTimeout(timer);
            }
        }

        function loadJS(url) {
            var scriptElement = document.getElementById("chartScript")
            if ( scriptElement != null) {
                scriptElement.remove()
            }
            scriptElement = document.createElement('script');
            scriptElement.id = "chartScript"
            scriptElement.src = url;
            document.getElementsByTagName('head')[0].appendChild(scriptElement);
        }

        function chartData() {
            fetch(`http://127.0.0.1:5654/db/tql`, {
                method: "POST",
                body: ` SQL_SELECT("time", "value", from("example", "webapp"), between("last-60s", "last"))
                        MAPVALUE(0, list(value(0), value(1)))
                        POPVALUE(1)
                        CHART(
                            size("600px", "400px"),
                            chartID('rspChart'),
                            theme('dark'),
                            chartOption({
                                xAxis:{ type: "time", axisLabel: { rotate: 30, interval:5 } },
                                yAxis:{ min: 0, max: 1.0},
                                animation: true,
                                series:[ { type:"line", data:column(0) } ]
                            })
                        )`
            }).then(function(rsp){
                return rsp.json()
            }).then(function(obj){
                document.getElementById('rspChart').style.width = obj.style.width
                document.getElementById('rspChart').style.height = obj.style.height
                obj.jsCodeAssets.forEach(js => loadJS(js)) 
            })
        }
    </script>
    <script src="http://127.0.0.1:5654/web/echarts/echarts.min.js"></script>
</head>
<body>
    <input type="button" id="btn" value="start" onclick="toggleTimer()" style="height:32px;width:64px;"/>
    <br/><br/>
    <div id=rspChart></div>
</body>
</html>
최근 업데이트