Dashboard Controls
Screen Layout
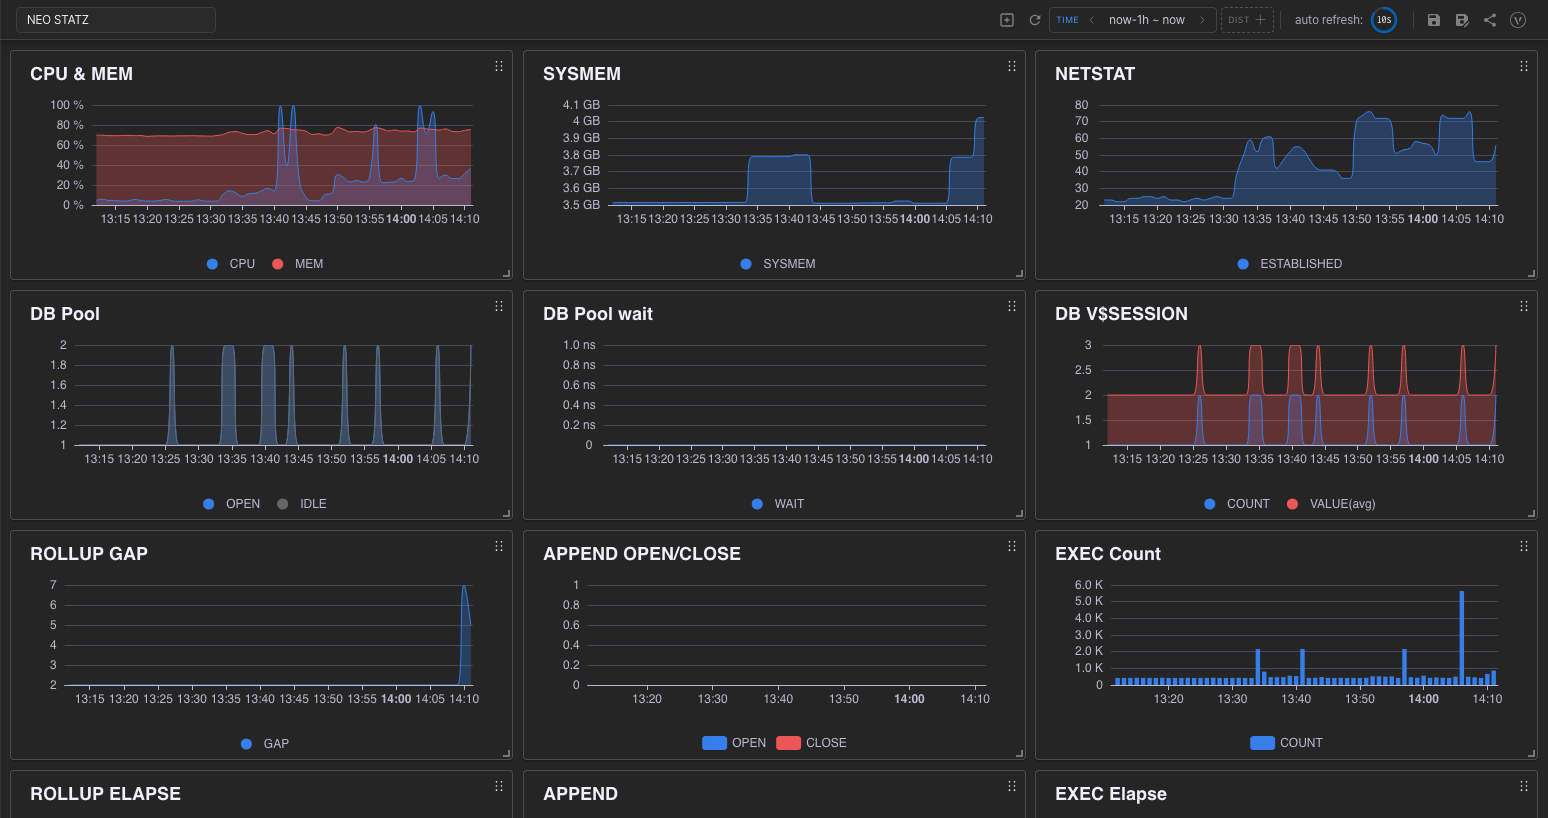
A dashboard consists of charts that display actual data. Each panel can be placed at any position and size.
- Top left: the dashboard title. Click it to rename the dashboard in place.
- Top right: the control area for the whole dashboard.
- Center: the area where chart panels are laid out.
Adding Charts
Click the  icon in the control area to open the chart settings screen. Choose the table to query in
 Table and the tag to show in Tag, then click Apply to draw the preview. After configuring the chart, click Save to add the panel to the dashboard.
※ See “Chart Settings” for details.
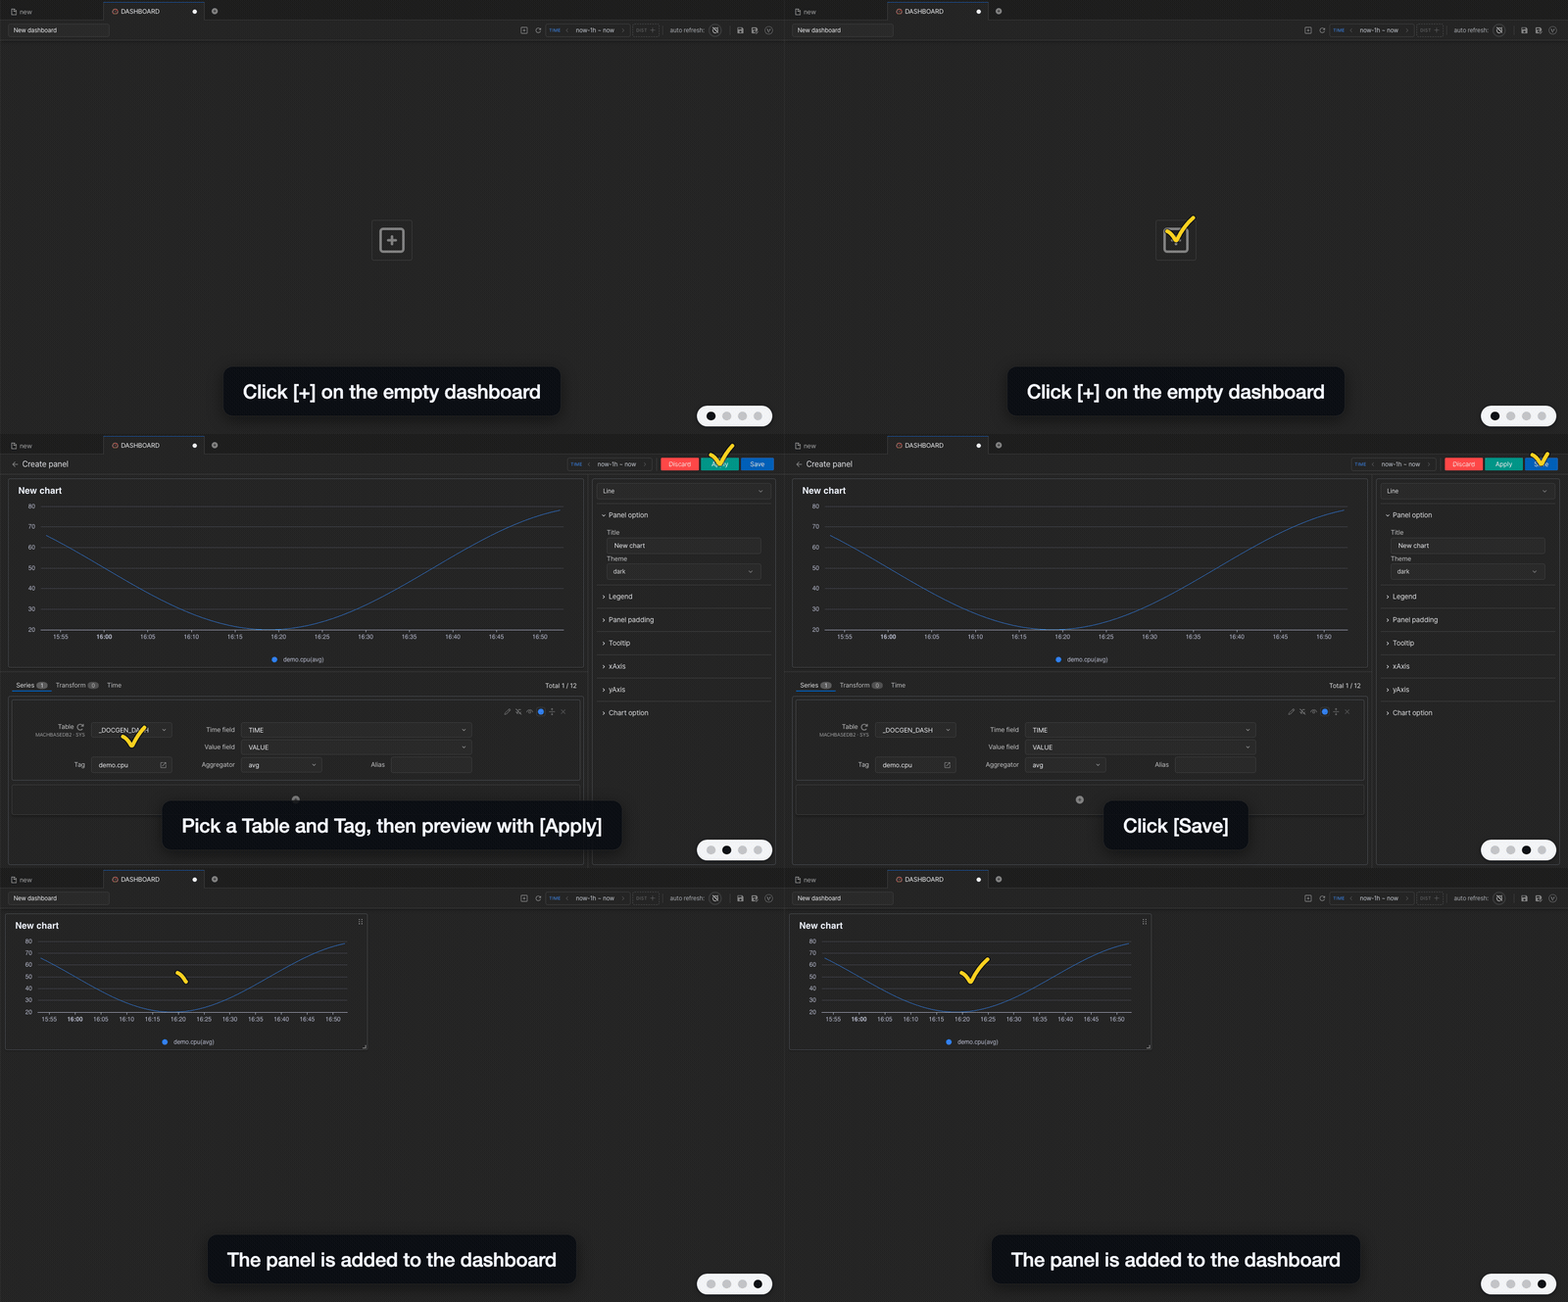
On a new dashboard with no panels, the  icon in the middle of the screen opens the same screen.
A new chart is placed at a default size. Drag the bottom-right corner to resize it and the top of the panel to move it. A panel cannot be made smaller than the size it was saved with.
Control Buttons

※ An unsaved dashboard shows the eight buttons below. Saving the dashboard adds a button that shares the view-mode link, and defining variables shows the variable values and a variables icon next to the title.
- Adds a new chart.
 Reloads data and updates the charts.
TIMEchip: sets the time range used for queries.DISTchip: sets the distance range for panels that query by distance. Sets the auto-refresh interval.
 Saves the current dashboard (file extension
 .dsh). For a new dashboard you can choose a file name and folder. Saves the dashboard with a new name.
 Sets up variables.
Since v8.0.46
Sets up variables.
Since v8.0.46
Time Range (TIME)
Clicking the chip opens the range dialog.
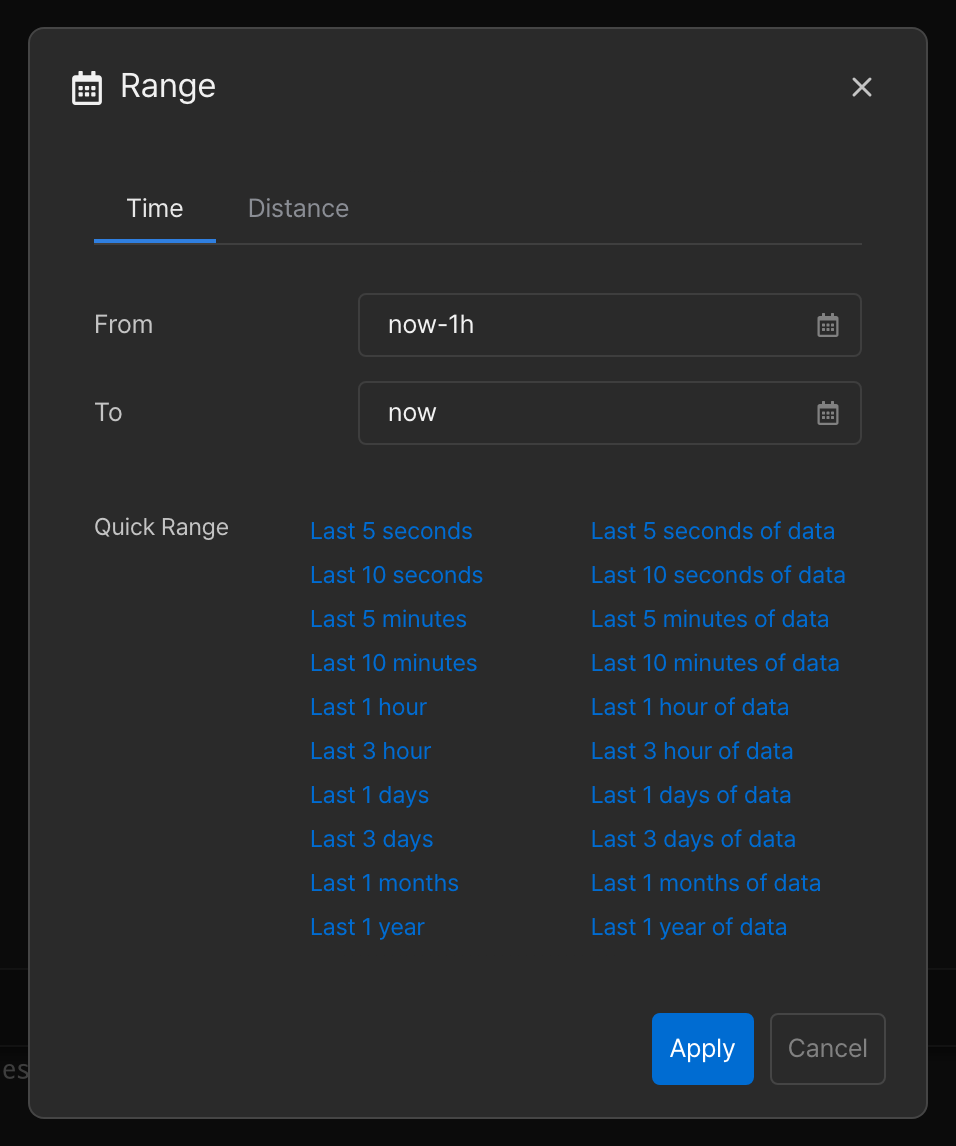
nowis the current time andlastis the last time of the data stored in the database.h/m/smean hours, minutes and seconds, sonow-3his three hours before the current time.- Clicking an item under “Quick Range” fills From/To. The right-hand list (
... of data) is based on the last time of the data. - The
<and>buttons beside the chip shift the range by 50%. Ifnoworlastis used, they are converted to absolute times.
Distance Range
Applies to panels that query by distance instead of time. Set it on the Distance tab of the same dialog.
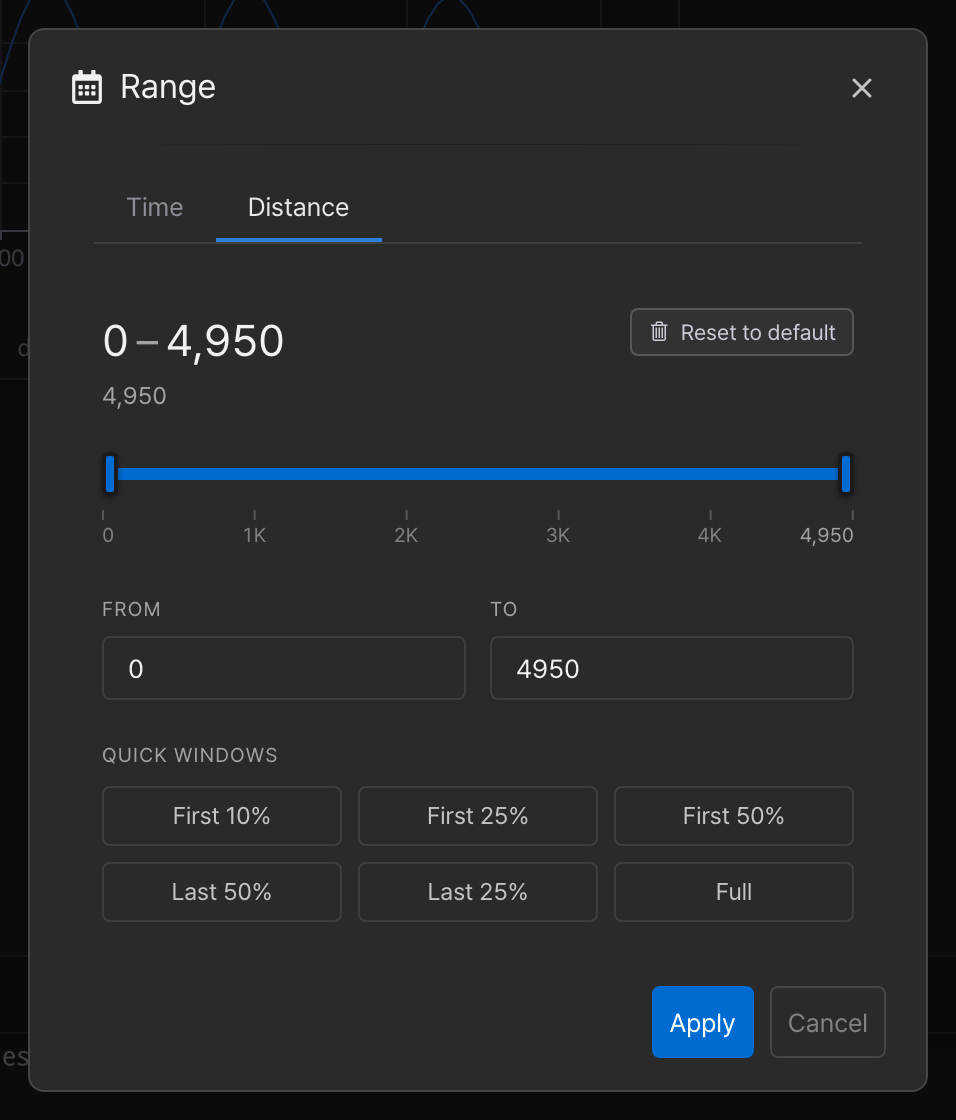
- Applies to — panels using a tag table whose base column is a number (distance, odometer and so on) rather than DATETIME. Such a table declares its base column as
BASE DISTANCE, for exampleCREATE TAG TABLE dist_data (NAME VARCHAR(80) PRIMARY KEY, DIST DOUBLE BASE DISTANCE, VALUE DOUBLE SUMMARIZED). If the dashboard has no such panel the data extent is unknown and the range shows0 – 0. - Data extent (min/max) — when the dialog opens it loads the minimum and maximum of the panel data and uses them as the ends of the slider. Set the range by dragging the slider or typing into FROM/TO; the top of the dialog shows the selected range (for example
0 – 1,237.5) and its length. - Anchor expressions — instead of numbers you can enter
first,last,first+1000orlast-1000, relative to the ends of the data. Likelast-1h ~ laston a time axis, the range follows the end of the data as it grows. Once applied, the chip also shows the expression as written, such aslast-1000 ~ last. - Quick windows — First 10%, First 25%, First 50%, Last 50%, Last 25% and Full set the range as a fraction of the data extent. They fill FROM/TO with anchor expressions; with a data extent of 0–4,950, First 25% gives
first~first+1237.5. Reset to default— clears the dashboard’s distance range immediately, without Apply, and closes the dialog. The chip returns to an empty chip with a dashed outline, and panels show their full data extent. A panel given its own range on the Distance tab of its chart settings keeps that range.
Auto Refresh
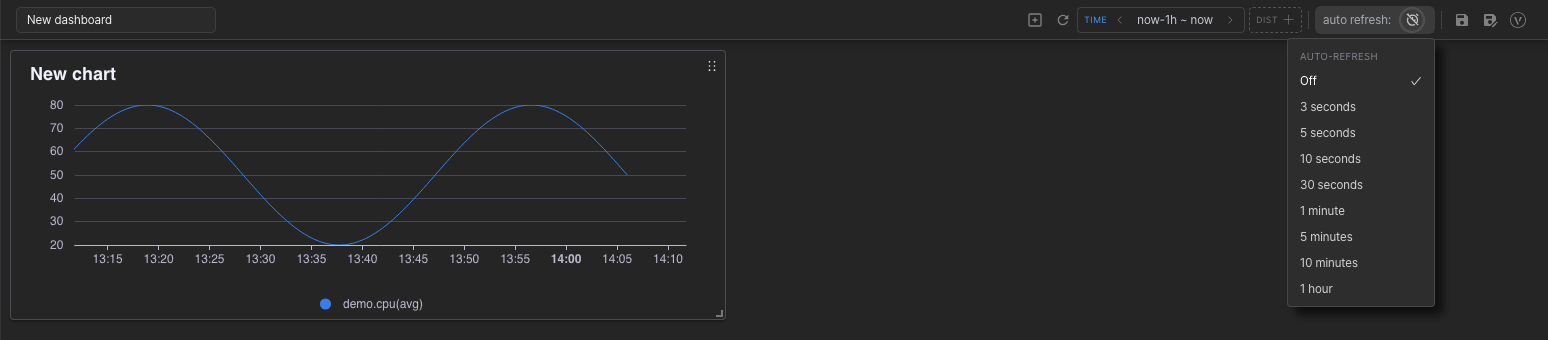
Choose Off, 3 seconds, 5 seconds, 10 seconds, 30 seconds, 1 minute, 5 minutes, 10 minutes or 1 hour. The whole dashboard is queried again at that interval. To use a different interval for a single panel, see the per-panel auto refresh in “Chart Panel”.
Sharing
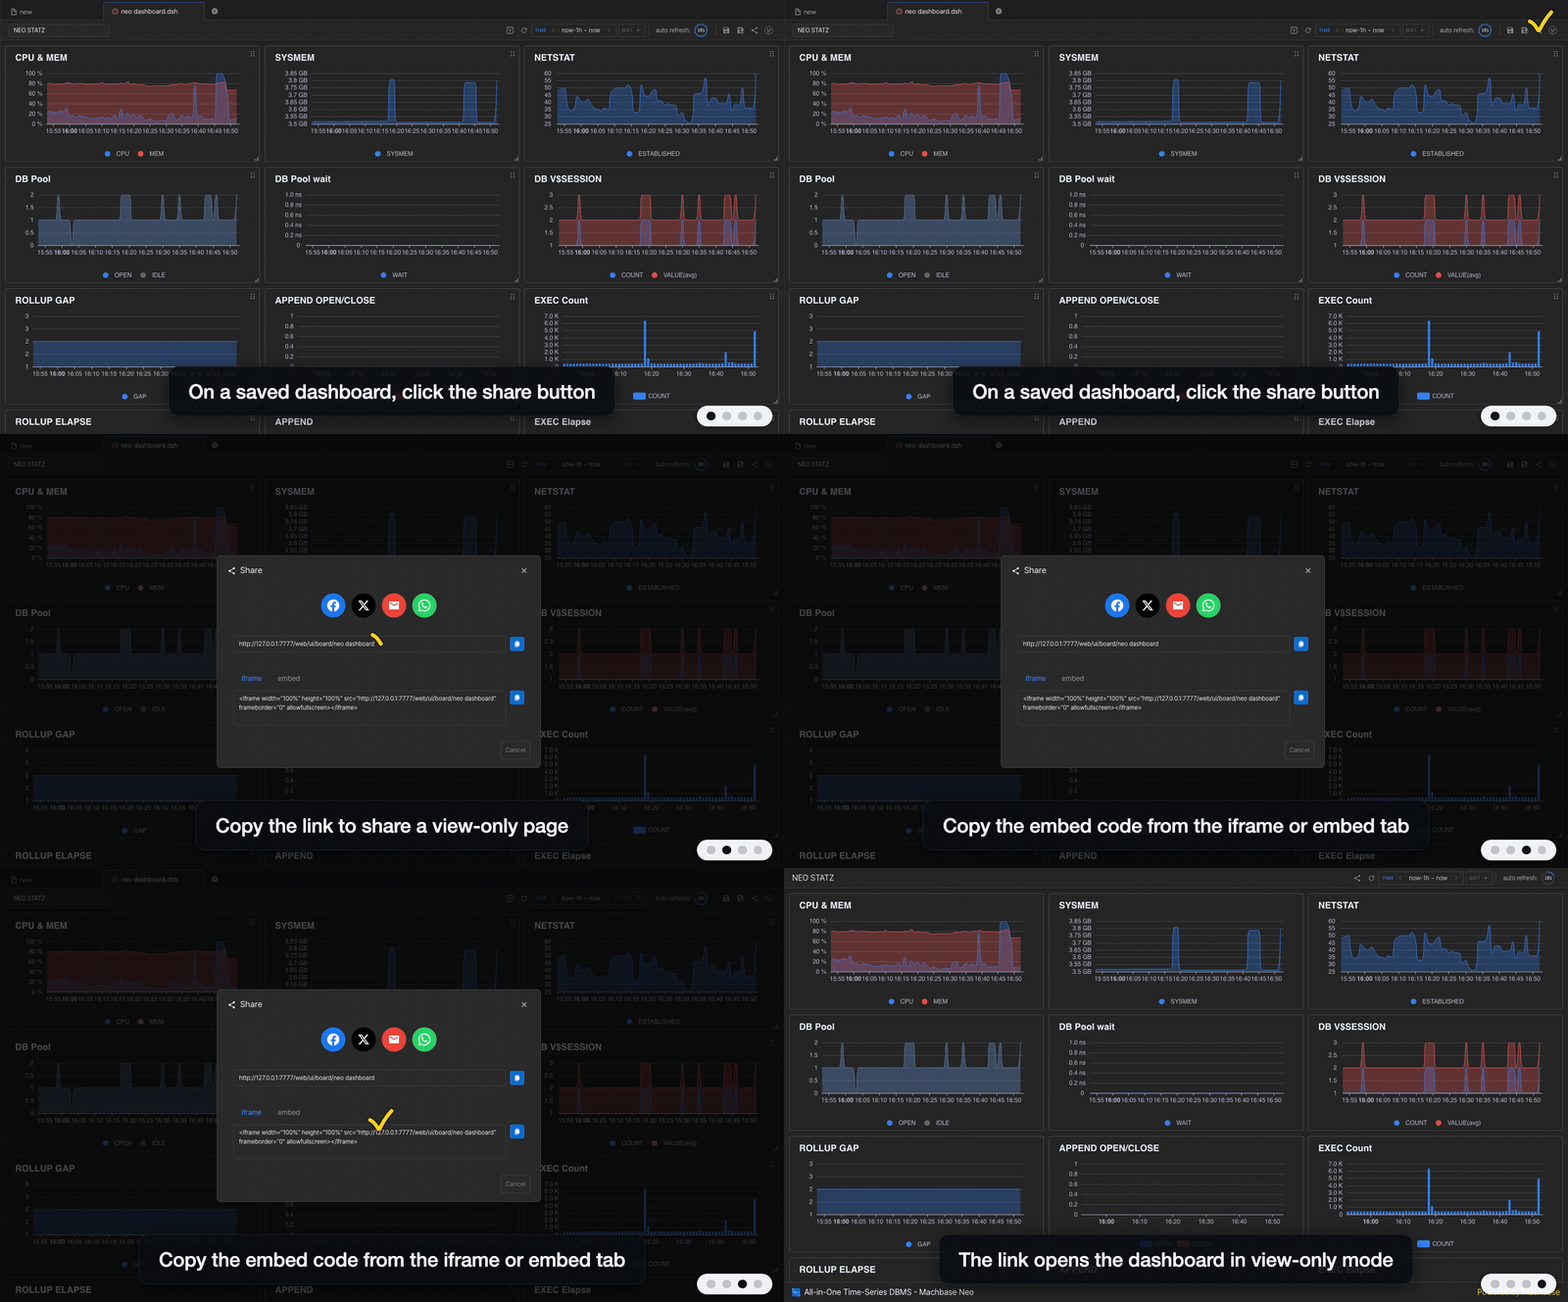
The share button appears only on a saved dashboard. Clicking it opens the Share dialog.
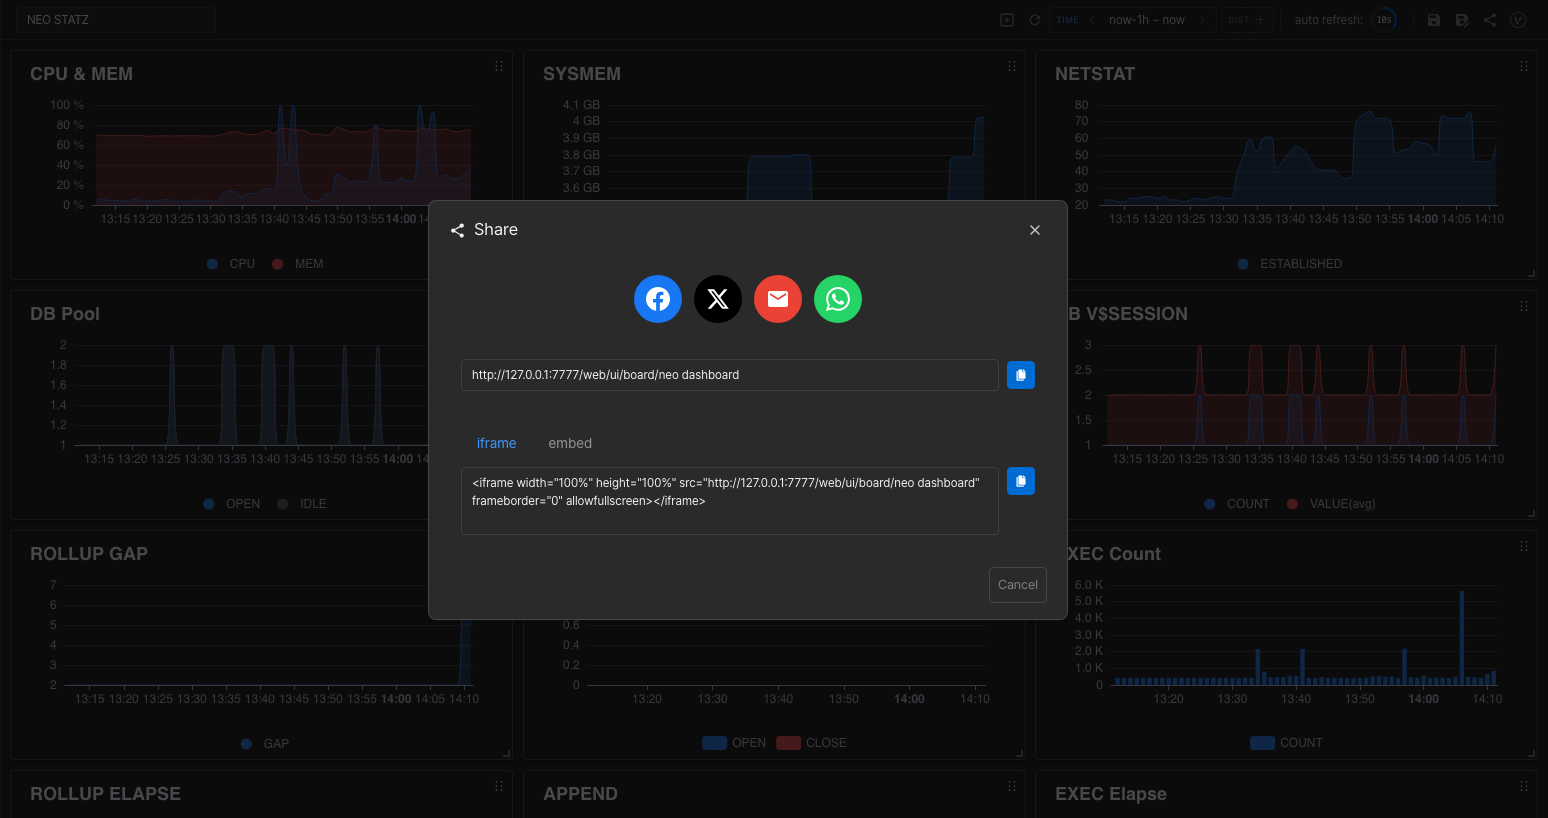
- Social buttons — send the link via Facebook, X, email or WhatsApp.
- Link — the view-only address, in the form
http://<server>/web/ui/board/<folder path>/<file name without extension>. Copy it with the button on the right. - iframe / embed — code for embedding the dashboard in another web page. Pick a tab and copy it with the button on the right.
View-only mode requires a login. Panels cannot be edited; only the time range (TIME), the distance range, auto refresh and refresh can be changed.
Variables
Since v8.0.46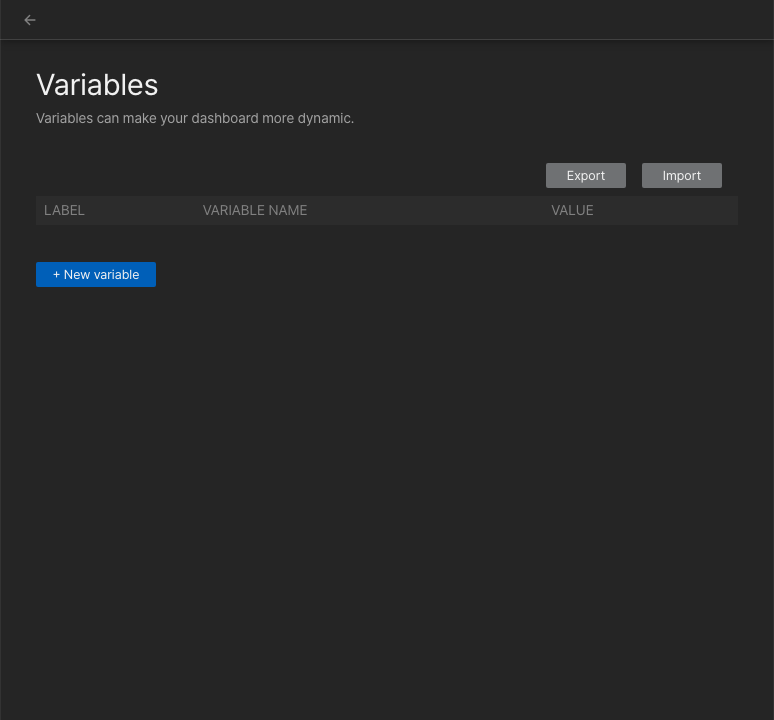
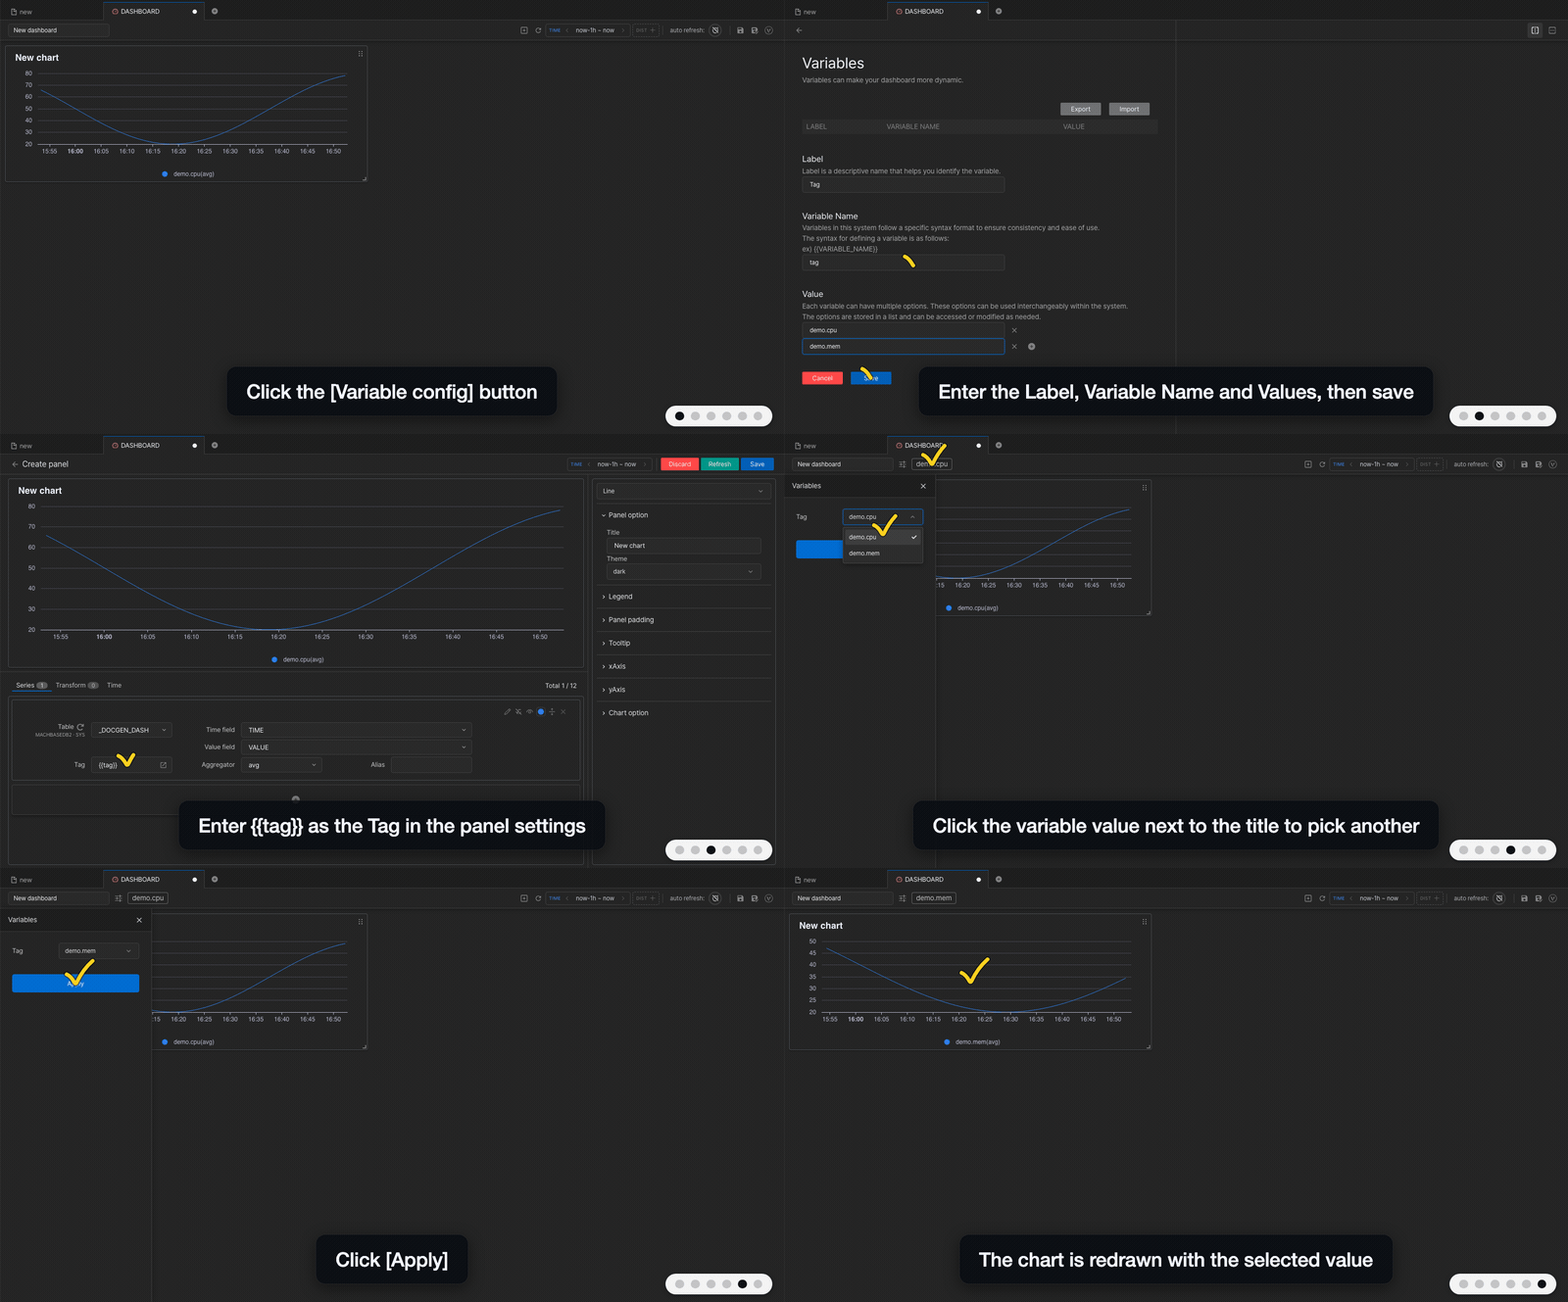
You can view, add, edit and delete the variables used by the dashboard. Export and Import move the variable settings in and out as LABEL,VARIABLE NAME,VALUES.
Click [+ New variable] to define a variable.
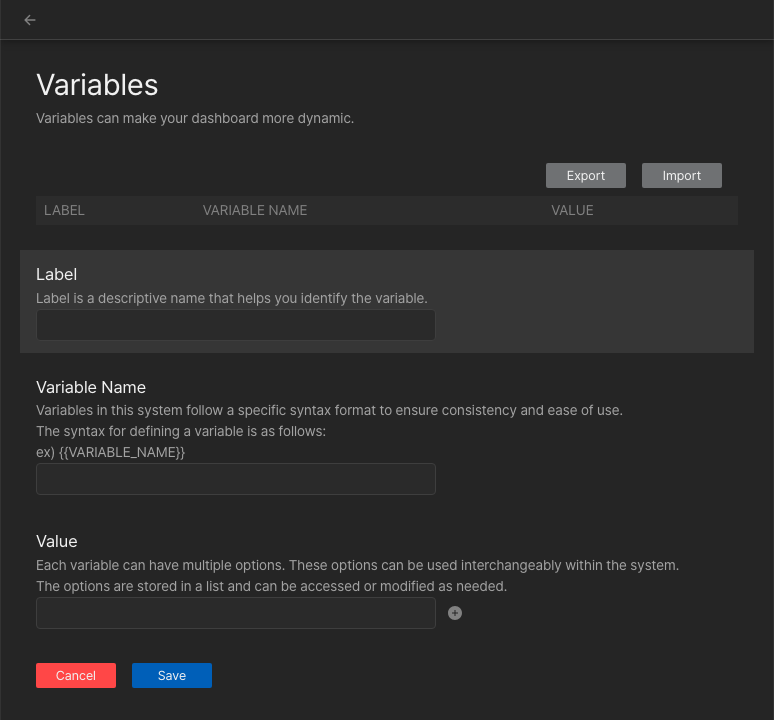
- Label — the title shown on the variable input field.
- Variable Name — the name used in chart settings. Typing
tagwithout braces saves it as{{tag}}; use it as{{tag}}in chart settings. - Value — the options available in the variable input field. Add more with the
 icon on the right.
Once a variable is defined, its current value appears next to the dashboard title. Click the value to open the variable drawer on the left, pick another value and click Apply to apply it to the charts. The icon next to the title shows all variables at once.