Options by Chart Type
The chart type is chosen at the top right of the chart settings screen. Eleven types are available — Line, Bar, Scatter, Adv scatter, Gauge, Pie, Liquid fill, Text, Geomap, Tql chart and Video — and the option list below the selector changes with the type. Panel option, Legend, Panel padding, Tooltip, xAxis and yAxis are shared by several types; see Chart Options in “Chart Settings”.
Tql chart and Video are configured differently and have their own pages (“TQL Chart”, “Video Panel”).
Line
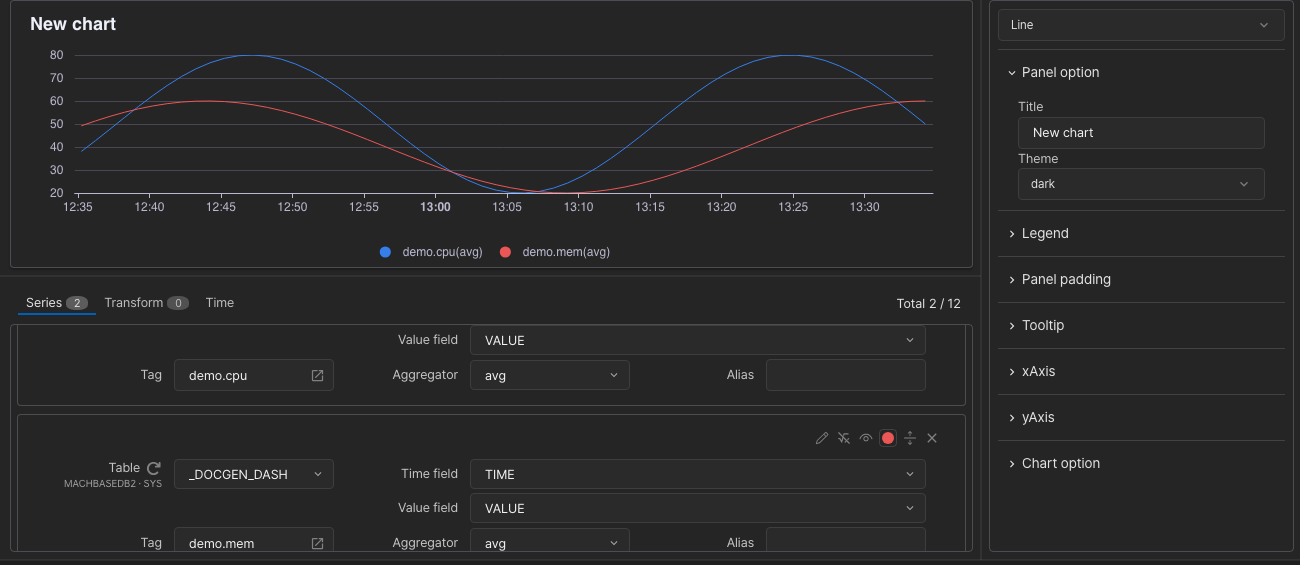
| Option | Desc |
|---|---|
| Fill area | Fills the area under the line. Takes an opacity (0–1). |
| Smooth line | Draws the line as a curve. |
| Show symbols | Draws the data points. |
| Symbol type | Symbol shape (circle / rect / roundRect / triangle / diamond / pin / arrow) |
| Symbol size | Size of the symbol |
| Stack | Stacks the series on top of each other. |
| Step style | Draws the line as steps. |
| Large data mode | Mode used when displaying a large amount of data. |
Bar
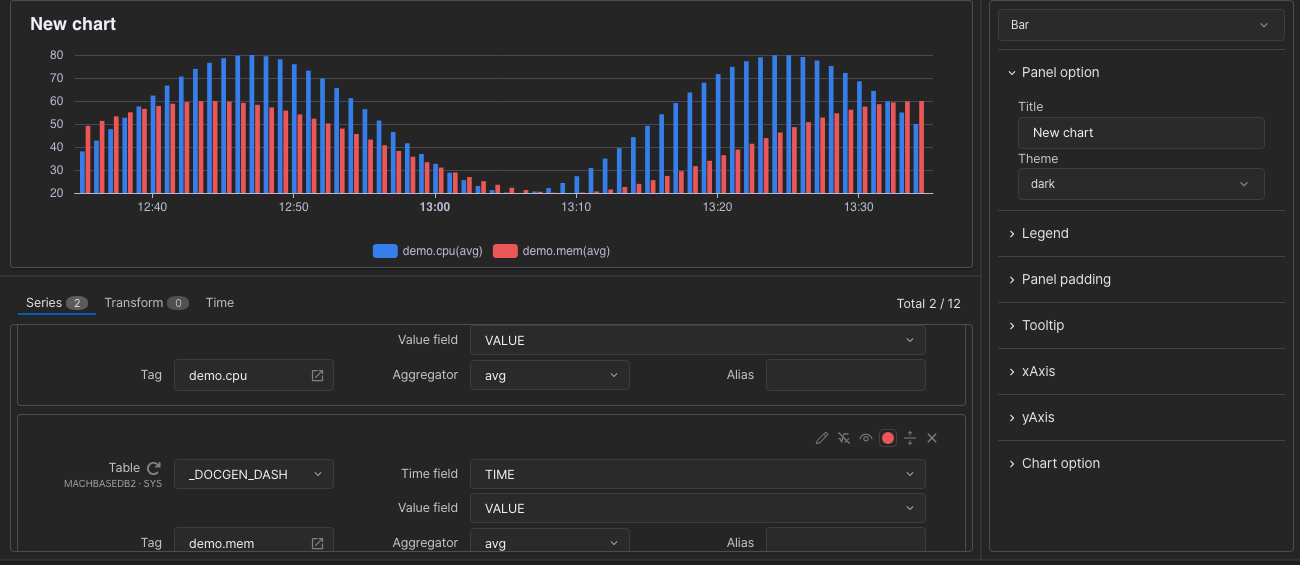
| Option | Desc |
|---|---|
| Large data mode | Mode used when displaying a large amount of data. |
| Polar mode | Arranges the bars around a circle. |
| - Max | Maximum value |
| - Start angle | Starting angle |
| - Radius | Inner radius (0 leaves no hole) |
| - Polar size | Outer radius (100 fills the panel) |
| - Polar axis | X-axis kind (time / category) |
Bar width is calculated automatically from the number of series and the panel size.
Scatter
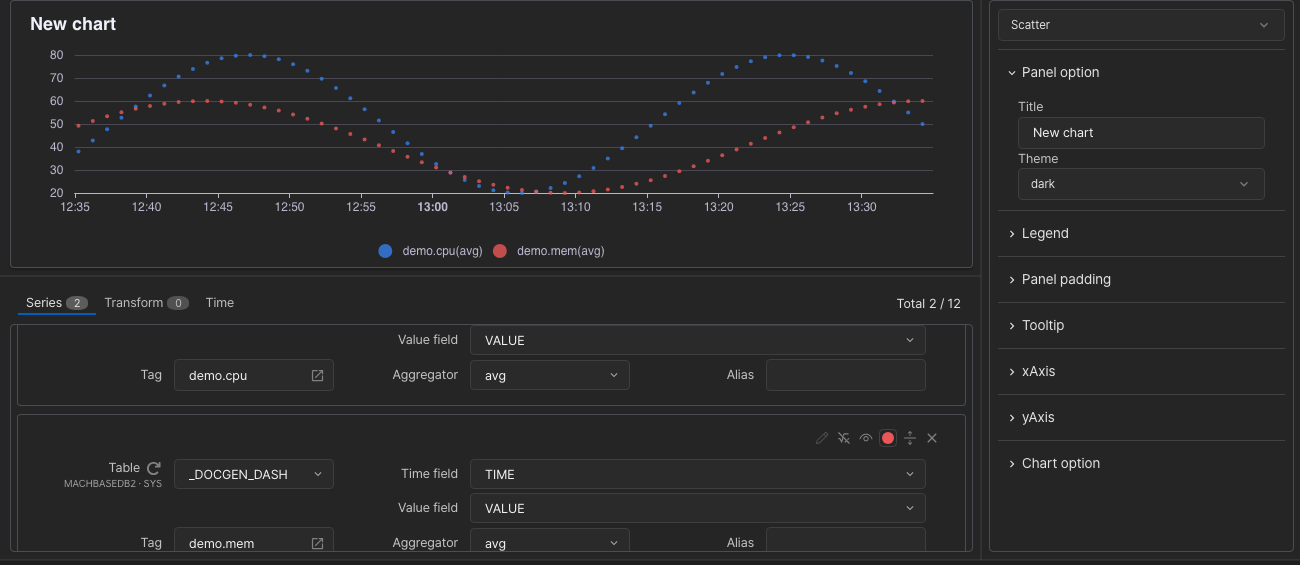
| Option | Desc |
|---|---|
| Large data mode | Mode used when displaying a large amount of data. |
| Symbol type | Symbol shape |
| Symbol size | Size of the symbol |
Adv scatter
Since v8.0.46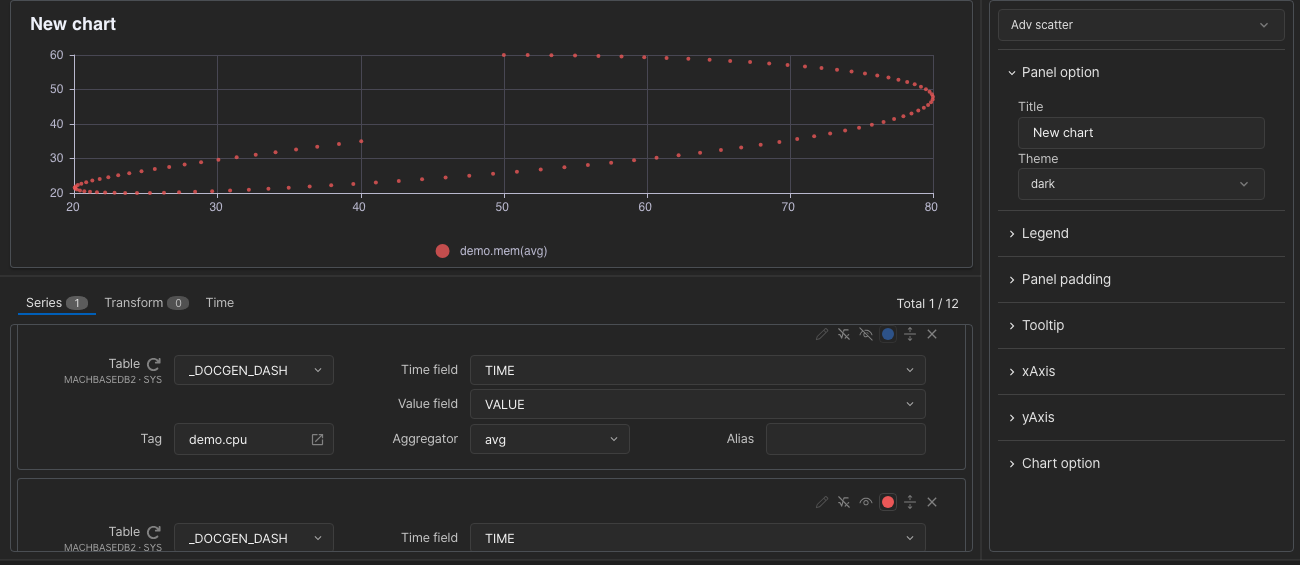
A scatter chart that uses values on both axes. Instead of time, the values of another series form the x-axis (the base axis).
- Choosing the base axis — pick the series to use as the base axis under
xAxis > Seriesin the right-hand options. Only one series can be selected; if none is chosen, the first series is the base axis. - How points are plotted — each value of a non-base series is paired with the base series value at the same time and drawn as one point (x, y).
- Hiding the base series — the base series only supplies x coordinates, so turn off the Visible
 icon on its series row to keep it from being drawn on its own.
The screen below uses demo.cpu as the base axis with Visible turned off, and plots demo.mem as the y values.
| Option | Desc |
|---|---|
| Unit / Decimals | Unit and decimal places of the x-axis values |
| Min / Max | Minimum and maximum of the x-axis |
| Start at zero | Always include 0 on the x-axis. |
| Series | The series used as the x-axis. The first series is used by default. |
| Symbol type / size | Shape and size of the symbol |
Gauge
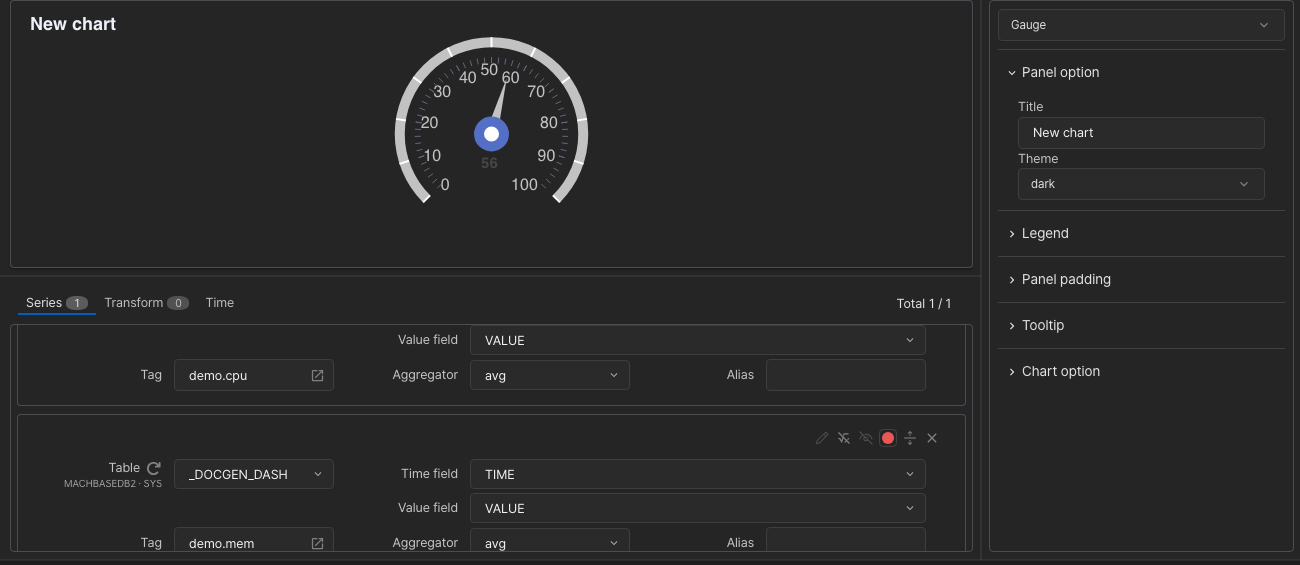
| Option | Desc |
|---|---|
| Min / Max | Minimum and maximum of the gauge |
| Label distance | Distance between the label and the arc (negative places it outside) |
| Show axis tick | Draws the ticks. |
| Setting line colors | Colours the arc by value range (given as a 0–1 ratio) |
| Show anchor / Size | Whether the centre circle is drawn, and its size |
| Font size | Font size of the value inside the gauge |
| Offset from center | Distance of the value from the centre |
| Unit | Unit of the gauge value |
| Decimal | Number of decimal places |
| Active animation | Whether animation is applied |
Pie
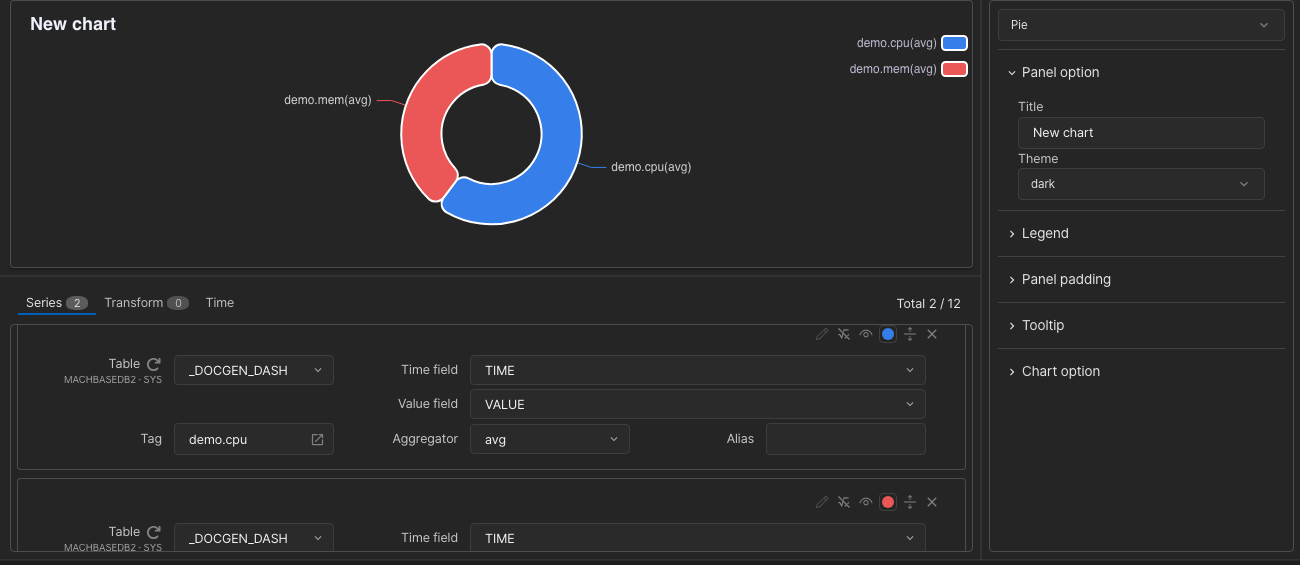
| Option | Desc |
|---|---|
| Doughnut ratio | Proportion of the hole in the middle (0–100) |
| Nightingale mode | Radius changes with the value |
Liquid fill
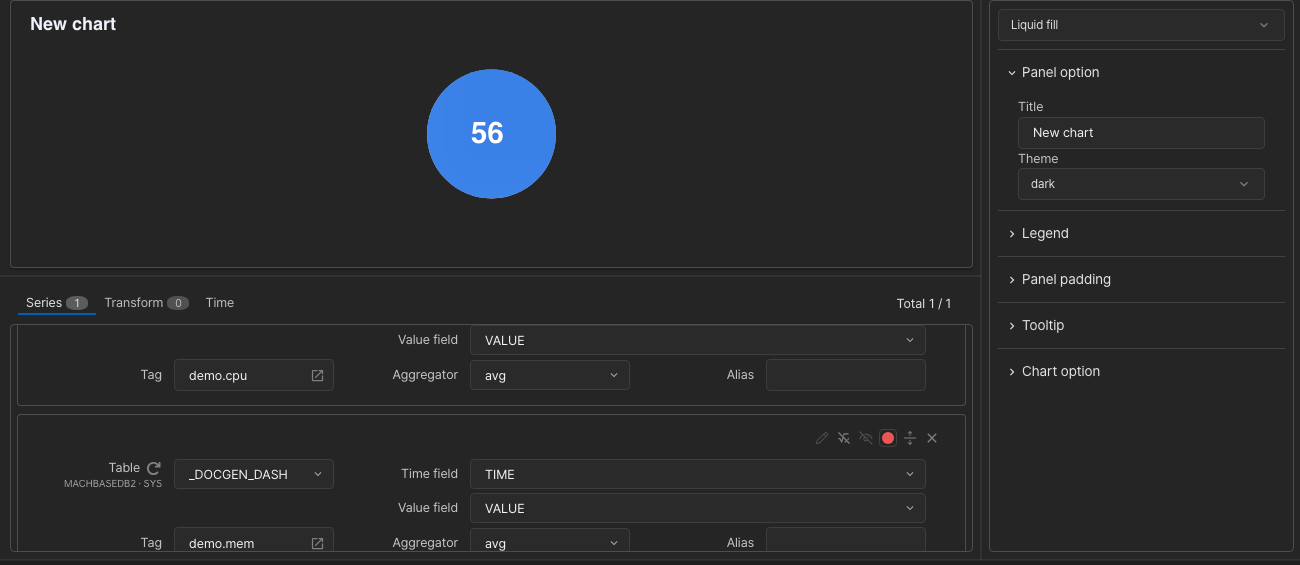
| Option | Desc |
|---|---|
| Shape | Shape (container / circle / rect / roundRect / triangle / diamond / pin / arrow) |
| Unit | Unit of the displayed value |
| Digit | Number of decimal places |
| Font size | Font size |
| Wave min / max | Minimum and maximum of the wave |
| Wave amplitude | Amplitude of the wave (0 draws a straight line) |
| Background color | Background colour of the wave area |
| Wave animation | Whether the wave is animated |
| Outline | Whether the outline is drawn |
Text
Since v8.0.46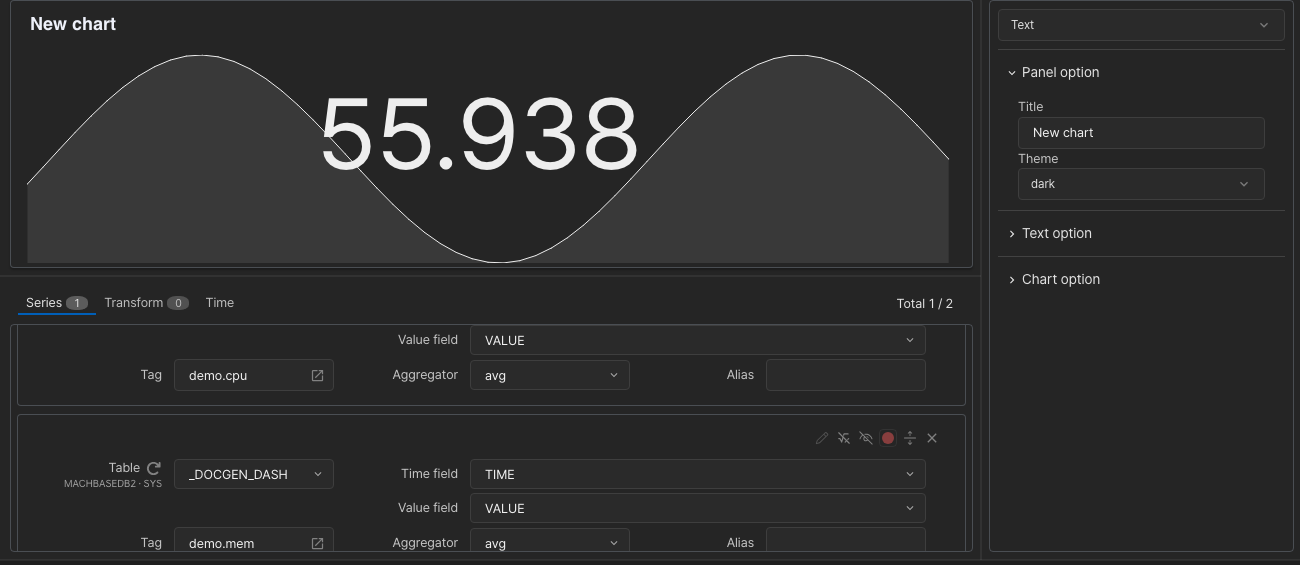
Shows the first series as large text and draws the second series as a background chart.
| Option | Desc |
|---|---|
| Font size | Font size |
| Unit | Unit |
| Digit | Number of decimal places |
| Color | Default colour. Value ranges can be added to colour the text differently above a threshold. |
| Series | The series used for the text and for the background chart. |
| Type | Background chart type (line / bar / scatter) |
| Opacity | Fill opacity (0–1, line only) |
| Symbol size | Size of the data points (0 hides them) |
Geomap
Since v8.0.46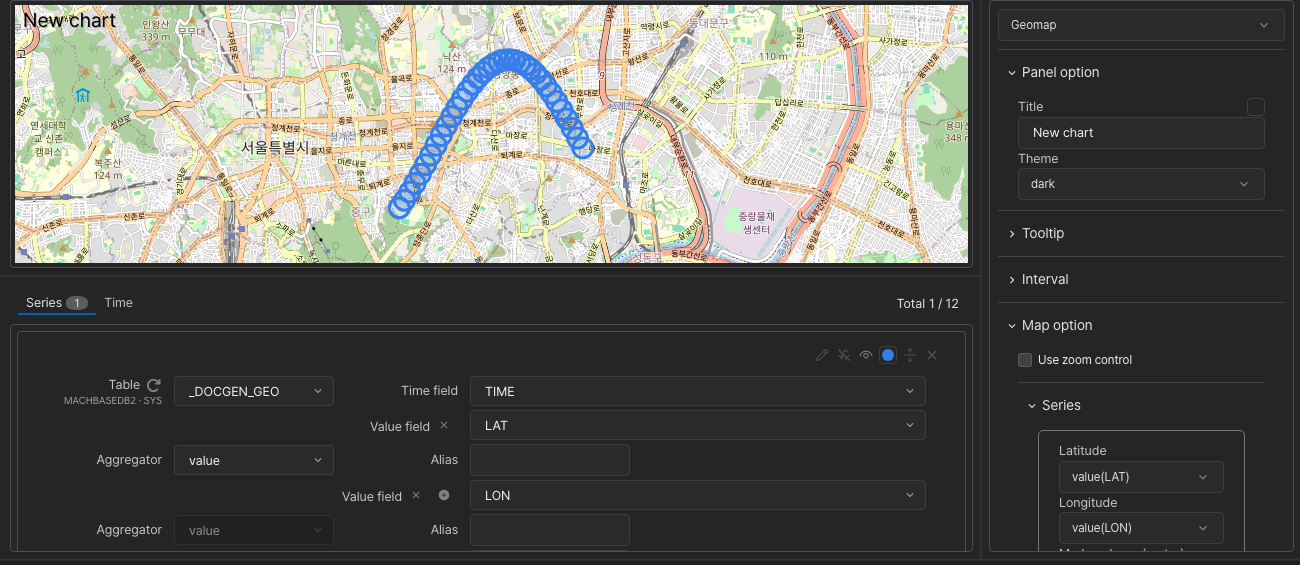
| Option | Desc |
|---|---|
| Time | Shows the time in the tooltip. |
| Latitude, Longitude | Shows the latitude and longitude in the tooltip. |
| Interval type / value | X-axis time interval (none / sec / min / hour; none is calculated automatically) |
| Use zoom control | Enables the map zoom control. It can also be toggled from the panel menu. |
| Series | Set per series: |
| - Latitude / Longitude | Names of the latitude and longitude columns |
| - Marker shape | Marker shape (marker / circleMarker / circle) |
| - Marker radius | Marker radius (pixels for circleMarker, metres for circle) |
Variations built from Line and Bar options
Area, stacked and step charts are not separate types — they are combinations of Line and Bar options.
| Desired chart | Type | Settings |
|---|---|---|
| Area | Line | turn on Fill area |
| Stacked area | Line | Fill area + Stack |
| Step | Line | Step style |
| Column | Bar | default |
| Polar bar | Bar | Polar mode |