TQL Chart
Overview
Selecting Tql chart as the chart type lets you use a TQL file you wrote as a dashboard panel.
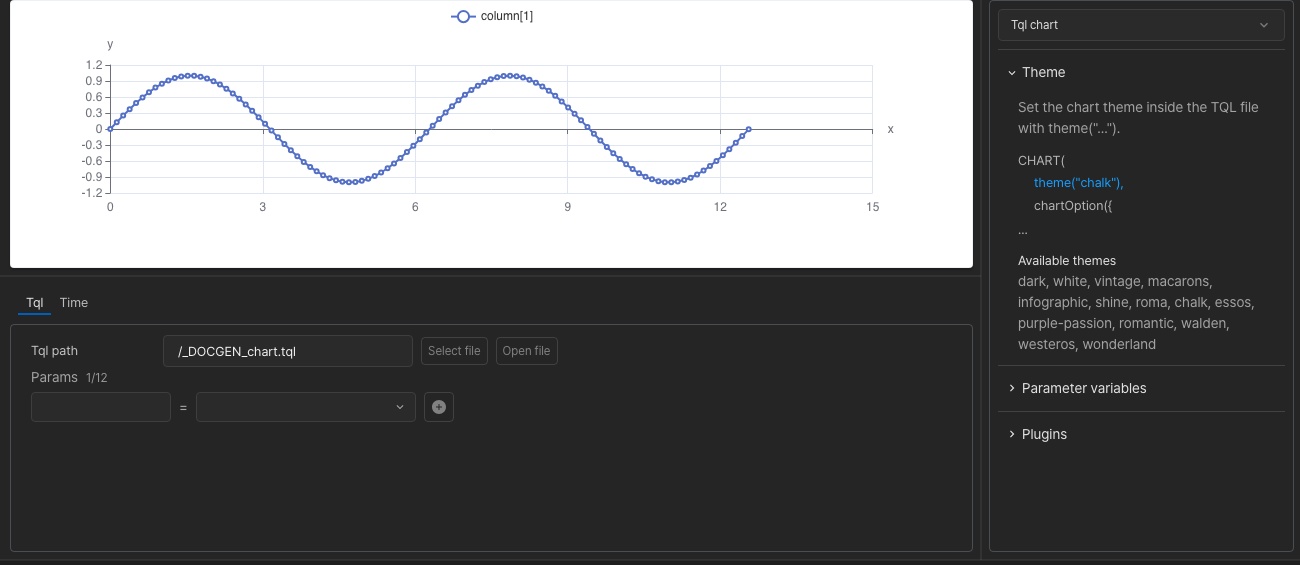
- Tql path — the TQL file to use. Pick it with
Select file, or open it in the editor withOpen file. - Params — the parameters passed to the TQL file. Enter values directly or use the variables the dashboard provides.
- Theme — the theme is set inside the TQL file with
CHART( theme("...") ). The available theme names are listed in the right-hand panel.
A TQL whose SINK is CHART is the common case, but TQL that outputs a table (CSV), Markdown, HTML, NDJSON or plain text is rendered in the panel as well. Panels showing output other than CHART are not auto-refreshed — neither by the dashboard nor by a panel interval — and re-query only when you press Refresh or change the time range.
Built-in Variables
Time range — used to keep this panel in step with the other panels on the dashboard.
| Params | Desc |
|---|---|
| {{from_str}} | date string (YYYY-MM-DD HH:MI:SS) |
| {{from_s}},{{from_ms}},{{from_us}},{{from_ns}} | unix timestamp (milli, micro, nano) |
| {{to_str}} | date string (YYYY-MM-DD HH:MI:SS) |
| {{to_s}},{{to_ms}},{{to_us}},{{to_ns}} | unix timestamp (milli, micro, nano) |
period — the x-axis interval, calculated from the time range and the panel size.
| Params | Desc |
|---|---|
| {{period}} | duration expression (ex: 10s) |
| {{period_value}} | period value (ex: 10) |
| {{period_unit}} | period unit (ex: sec) |
Using Parameters in a TQL File
Inside the TQL file, param() reads the values the dashboard passed in.
SQL(strSprintf(`
SELECT date_trunc('%s', TIME, %1.0f) as TIME, avg(VALUE) as VALUE
FROM EXAMPLE
WHERE TIME between FROM_UNIXTIME(%1.0f) and FROM_UNIXTIME(%1.0f) AND NAME IN ('%s')
GROUP BY TIME ORDER BY TIME`,
(param('period_unit') ?? 'msec'),
parseFloat(param('period_value') ?? 10),
parseFloat(param('from') ?? 1703055573),
parseFloat(param('to') ?? 1703055583),
(param('tag') ?? 'tag01')
))

CHART_LINE()
SQL() — builds the query dynamically with param() and strSprintf(). The main parameters are period_unit (default msec), period_value (default 10), from and to (the query range), and tag (the tag to query, default tag01).
CHART_LINE() — draws the query result as a line chart.