vizspec
The vizspec module is the JSH API for building, validating, parsing, and converting ADVN documents.
ADVN, short for Analysis Data Visualization Notation, is the renderer-neutral document format for analysis visualization.
Use ADVN when you want to keep analytical meaning separate from renderer-specific output.
ADVN And vizspec
- ADVN is the semantic layer.
- ADVN is the document format. It describes what the analysis result means.
- The
vizspecmodule is the JSH API that creates and transforms ADVN documents. vizis the command-line tool that validates, previews, and exports ADVN documents.
Basic Example
| |
Constants
The module exports the following constant groups.
RepresentationKindAnnotationKindTimeformat
Use these constants when you want explicit and typo-safe ADVN values in application code.
RepresentationKind
| Member | Value | Description |
|---|---|---|
RepresentationKind.rawPoint | raw-point | Raw point samples such as [x, y]. |
RepresentationKind.timeBucketValue | time-bucket-value | Aggregated time bucket with a single numeric value. |
RepresentationKind.timeBucketBand | time-bucket-band | Aggregated time bucket with min/max/avg band values. |
RepresentationKind.distributionHistogram | distribution-histogram | Histogram distribution buckets. |
RepresentationKind.distributionBoxplot | distribution-boxplot | Boxplot distribution groups. |
RepresentationKind.eventPoint | event-point | Instant events at one time/value point. |
RepresentationKind.eventRange | event-range | Duration events with from/to time range. |
AnnotationKind
| Member | Value | Description |
|---|---|---|
AnnotationKind.point | point | A point annotation at one position. |
AnnotationKind.line | line | A threshold or reference line annotation. |
AnnotationKind.range | range | A highlighted range annotation. |
Timeformat
| Member | Value | Description |
|---|---|---|
Timeformat.rfc3339 | rfc3339 | RFC3339 string time representation. |
Timeformat.s | s | Epoch seconds. |
Timeformat.ms | ms | Epoch milliseconds. |
Timeformat.us | us | Epoch microseconds. |
Timeformat.ns | ns | Epoch nanoseconds. |
parse()
Parses an ADVN JSON string and returns a normalized spec object.
Syntax
parse(text)Parameters
| Name | Type | Description |
|---|---|---|
text | string | ADVN JSON text to parse. |
Usage example
| |
stringify()
Serializes a spec object into ADVN JSON text.
Syntax
stringify(spec)Parameters
| Name | Type | Description |
|---|---|---|
spec | object | ADVN spec object to serialize. |
Usage example
| |
validate()
Validates a spec object. Throws on invalid structure or field combinations.
Syntax
validate(spec)Parameters
| Name | Type | Description |
|---|---|---|
spec | object | ADVN spec object to validate. |
Usage example
| |
normalize()
Normalizes a partially specified spec object and fills default structural fields.
Syntax
normalize(spec)Parameters
| Name | Type | Description |
|---|---|---|
spec | object | Partial ADVN spec object to normalize. |
Usage example
| |
createSpec()
Creates, normalizes, and validates a spec object from an initializer.
Syntax
createSpec(init)Parameters
| Name | Type | Description |
|---|---|---|
init | object | Initial fields for the ADVN spec. |
Usage example
| |
listSeries()
Returns a normalized summary list for spec.series.
Syntax
listSeries(spec)Parameters
| Name | Type | Description |
|---|---|---|
spec | object | ADVN spec object to inspect. |
Return fields
| Field | Type | Description |
|---|---|---|
index | integer | Zero-based series index in spec.series. |
id | string | Series id. |
name | string | Series name when present. |
title | string | Display title. Uses name first, then id. |
kind | string | Representation kind. |
tuiLinesCompatible | boolean | Whether toTUILines() can render the series. |
Usage example
| |
Series Helpers
Series helper functions create series objects with the correct representation kind and default field layout.
Available helpers:
rawPointSeries(init)timeBucketValueSeries(init)timeBucketBandSeries(init)distributionHistogramSeries(init)distributionBoxplotSeries(init)eventPointSeries(init)eventRangeSeries(init)
Syntax
timeBucketValueSeries(init)
eventRangeSeries(init)
Common initializer fields
| Name | Type | Description |
|---|---|---|
id | string | Series identifier. |
name | string | Display name used by adapters. |
axis | string | Y-axis id for numeric renderers. |
representation | object | Optional overrides for fields or representation metadata. |
data | array | Series payload rows. |
style | object | Renderer-hint style values such as color or opacity. |
quality | object | Quality metadata such as coverage or row count. |
source | object | Provenance metadata for the series. |
extra | object | Extra representation-specific data such as boxplot outliers. |
Usage example
| |
Annotation Helpers
Annotation helper functions create top-level annotation objects with the correct annotation kind.
Available helpers:
pointAnnotation(init)lineAnnotation(init)rangeAnnotation(init)
Syntax
lineAnnotation(init)
rangeAnnotation(init)
Common initializer fields
| Name | Type | Description |
|---|---|---|
axis | string | Target axis id. |
label | string | Human-readable annotation label. |
value | any | Value used by line or point annotations. |
at | any | Position used by point annotations. |
from | any | Range start value. |
to | any | Range end value. |
style | object | Optional renderer-hint style values. |
Usage example
| |
Builder
Use the builder when you want fluent ADVN document construction.
Syntax
new Builder([init])Common methods
| Method | Description |
|---|---|
setDomain(definition) | Sets spec.domain. |
setXAxis(definition) | Sets spec.axes.x. |
addYAxis(definition) | Appends one y-axis definition. |
addRawPointSeries(definition) | Adds a raw-point series. |
addTimeBucketValueSeries(definition) | Adds a time-bucket-value series. |
addTimeBucketBandSeries(definition) | Adds a time-bucket-band series. |
addDistributionHistogramSeries(definition) | Adds a histogram series. |
addDistributionBoxplotSeries(definition) | Adds a boxplot series. |
addEventPointSeries(definition) | Adds an event-point series. |
addEventRangeSeries(definition) | Adds an event-range series. |
addAnnotation(definition) | Adds an annotation object. |
addLineAnnotation(definition) | Adds a line annotation. |
addRangeAnnotation(definition) | Adds a range annotation. |
setView(definition) | Sets spec.view. |
setMeta(definition) | Sets spec.meta. |
build() | Returns a normalized spec. |
stringify() | Serializes the built spec. |
listSeries() | Returns the normalized series summary list. |
toEChartsOption(options) | Builds and converts to ECharts options. |
toTUILines(options) | Builds and converts to terminal-ready TUI chart lines. |
toTUIBlocks(options) | Builds and converts to TUI blocks. |
toSVG(options) | Builds and converts to SVG text. |
toPNG([svgOptions[, pngOptions]]) | Builds and converts to PNG binary data. |
Usage example
| |
Output Adapters
toEChartsOption()
Converts a spec into an ECharts option object.
Syntax
toEChartsOption(spec[, options])Parameters
| Name | Type | Description |
|---|---|---|
spec | object | ADVN spec object to render. |
options | object | Optional output-side time settings. |
Option fields
| Option | Type | Default | Description |
|---|---|---|---|
timeformat | string | rfc3339 | Output time representation used when encoding time values for ECharts. |
tz | string | local timezone | Output timezone used when rendering RFC3339 time values. |
Usage example
| |
toTUILines()
Converts the first sparkline-compatible series into terminal-friendly sparkline lines.
Syntax
toTUILines(spec[, options])Parameters
| Name | Type | Description |
|---|---|---|
spec | object | ADVN spec object to render. |
options | object | Optional sparkline rendering settings. |
Option fields
| Option | Type | Default | Description |
|---|---|---|---|
height | integer | 3 | Chart height used for raw-point and time-bucket-value line output. |
width | integer | 40 | Width used to sample values and render the sparkline body. |
seriesId | string | first compatible series | Selects the series to render by series[].id. |
timeformat | string | rfc3339 | Output time format used for sparkline x-axis labels. |
tz | string | local timezone | Output timezone used for sparkline x-axis labels. |
Notes:
toTUILines()returns the first sparkline-compatible series whenseriesIdis not provided.- When
seriesIdis provided,toTUILines()renders the matchingseries[].id. - Use
listSeries()when you need to discover selectable series ids ahead of time. - If
seriesIddoes not exist or points to a non-sparkline series, the adapter throws an error. - The return value is an array of terminal-ready lines for a multi-line TUI chart.
- Unlike
toTUIBlocks(), this adapter keeps the expanded multi-line chart form with axis labels. heightapplies toraw-pointandtime-bucket-valueoutput.time-bucket-bandkeeps itsmax/avg/minline form.toTUILines()currently ignoresrowsandcompacteven if they are provided.
Usage example
| |
CLI example:
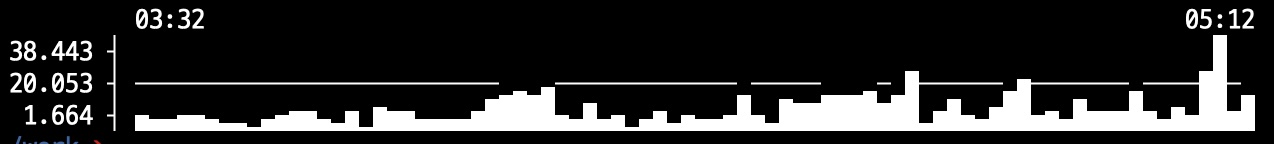
viz lines --height 5 --series series-1 sample.jsonFull source code:
| |
Example output:
toTUIBlocks()
Converts a spec into TUI block objects for terminal inspection.
Syntax
toTUIBlocks(spec[, options])Parameters
| Name | Type | Description |
|---|---|---|
spec | object | ADVN spec object to render. |
options | object | Optional TUI rendering settings. |
Option fields
| Option | Type | Default | Description |
|---|---|---|---|
width | integer | 40 | Width used for sparkline, histogram, and timeline rendering. |
rows | integer | 8 | Maximum detail rows shown in table, histogram, and event blocks. |
compact | boolean | false | Hides series summary and raw data table blocks. |
timeformat | string | rfc3339 | Output time format: rfc3339, s, ms, us, ns. |
tz | string | local timezone | Output timezone used with rendered time values. |
Return value
The return value is an array of block objects. Each block may contain the following fields.
| Field | Type | Description |
|---|---|---|
type | string | Block kind such as summary, series-summary, sparkline, bandline, bars, box-summary, event-list, timeline, table, annotations. |
title | string | Block title. |
stats | array | Array of { label, value } objects used by summary-style blocks. |
lines | array | Array of rendered text lines used by sparkline, timeline, histogram, and similar line-oriented blocks. A sparkline block currently returns one compact sparkline line. |
columns | array | Column names used by table blocks. |
rows | array | Table row array used by table blocks. Each row is an array of values ordered by columns. |
meta | object | Block-specific metadata such as representation, axis, totalRows, or truncated. |
The populated fields vary by type. For example, a sparkline block mainly uses lines, while a table block uses columns, rows, and meta.
Notes:
sparklineblocks intoTUIBlocks()return the original compact sparkline representation.- If you want the expanded sparkline with axis labels and multiple chart rows, use
toTUILines()instead.
Usage example
| |
toSVG()
Converts a spec into an SVG string.
Syntax
toSVG(spec[, options])Parameters
| Name | Type | Description |
|---|---|---|
spec | object | ADVN spec object to render. |
options | object | Optional SVG rendering settings. |
Option fields
| Option | Type | Default | Description |
|---|---|---|---|
width | integer | 960 | SVG canvas width in pixels. |
height | integer | 420 | SVG canvas height in pixels. |
padding | integer | 48 | Outer chart padding in pixels. |
background | string | white | SVG background color. |
fontFamily | string | sans-serif | Base font family. |
fontSize | integer | 12 | Base font size in pixels. |
showLegend | boolean | true | Controls whether legend rendering is enabled. |
title | string | empty | Optional chart title. |
timeformat | string | rfc3339 | Output time format used for axis labels and rendered time values. |
tz | string | local timezone | Output timezone used with RFC3339 time rendering. |
Usage example
| |
toPNG()
Converts a spec into PNG binary data. The return value is an ArrayBuffer, which you can read with new Uint8Array(png) when needed.
Syntax
toPNG(spec[, options])Parameters
| Name | Type | Description |
|---|---|---|
spec | object | ADVN spec object to render. |
options | object | Optional combined chart layout, text, output-time, and rasterization settings. |
Option fields
Layout and text fields:
| Option | Type | Default | Description |
|---|---|---|---|
width | integer | 960 | Output width in pixels before raster scaling. |
height | integer | 420 | Output height in pixels before raster scaling. |
padding | integer | 48 | Outer chart padding in pixels. |
background | string | white | Background color applied to both the SVG layout and PNG raster output. |
fontFamily | string | sans-serif | Base font family. |
fontSize | integer | 12 | Base font size in pixels. |
showLegend | boolean | true | Controls whether legend rendering is enabled. |
title | string | empty | Optional chart title. |
timeformat | string | rfc3339 | Output time format used for axis labels and rendered time values. |
tz | string | local timezone | Output timezone used with RFC3339 time rendering. |
Rasterization fields:
| Option | Type | Default | Description |
|---|---|---|---|
scale | number | 1 | Scales the SVG-based layout before rasterization. |
dpi | integer | unset | Target DPI used when scale is not provided. Internally this is applied as dpi / 96. |
theme | string | mrtg | PNG theme name. Currently only mrtg is supported. |
Notes:
- When both
scaleanddpiare provided,scaletakes precedence. - The current PNG renderer produces MRTG-style output.
- The JavaScript API accepts a single
optionsobject and internally splits layout and raster fields. - The older
toPNG(spec, svgOptions, pngOptions)call shape is still accepted for compatibility.
Usage example
| |
Time Handling
When you use epoch timestamps in s, ms, us, or ns, the value already represents an absolute UTC-based
instant, so the input data does not need an explicit timezone. Treat timezone as an output-side rendering option,
not as part of the epoch value itself.
This matters especially for ns. Nanosecond epoch values can exceed JavaScript’s safe integer range, so using
number may lose precision. Values such as 1712102400000000000 should be passed as strings.
For Machbase Neo timestamp data, prefer:
timeformat: vizspec.Timeformat.ns- string timestamps instead of JavaScript numbers
Example:
const spec = vizspec.createSpec({
    domain: {
        kind: 'time',
        timeformat: vizspec.Timeformat.ns,
    },
    series: [vizspec.eventRangeSeries({
        id: 'maintenance',
        data: [['1712102400000000000', '1712102460000000000', 'maintenance']],
    })],
});
Time Rendering
Source-side time encoding and output-side time representation are separate concerns.
domain.timeformatdescribes how timestamps in the ADVN document are encoded.- adapter
timeformatandtzoptions describe how those timestamps should be rendered.
When adapter options are omitted, vizspec adapters default to rfc3339 and the local timezone.
Example:
const svg = vizspec.toSVG(spec, {
    title: 'CPU Usage',
    width: 960,
    height: 420,
    timeformat: vizspec.Timeformat.rfc3339,
    tz: 'Asia/Seoul',
});
The same rule applies to toTUIBlocks() and toEChartsOption().
Using viz command
Validate the generated spec:
/work > viz validate cpu-usage.json
VALID version=1 series=1 annotations=1
Preview the spec in the terminal:
/work > viz view cpu-usage.jsonExport the spec to SVG:
/work > viz export --title "CPU Usage" --output cpu-usage.svg cpu-usage.jsonRender terminal output with explicit output-side time settings:
/work > viz view --timeformat rfc3339 --tz Asia/Seoul cpu-usage.json