TQL
TQL
Reading and transforming data sent by sensors into the format you want, or delivering values stored in the database to other systems in the format they require, calls for a dedicated tool. TQL is the Machbase transformation language that lets you process such data easily and flexibly.
Generate example ‘signal’ data
First, generate sample data for the examples below.
SCRIPT({
    const m = require('mathx');
    const gen = m.oscillator({
        components: [
            {frequencyHz: 15, amplitude: 1.0},
            {frequencyHz: 24, amplitude: 1.5},
        ],
        timeRange: {from: 'now', to: 'now+10s'},
        sample: "1000Hz",
    });
    gen.forEach((g)=>{ $.yield(g[0], g[1]) });
})
SQL(`insert into example(name,time,value) values('signal',?,?)`,
value(0), value(1))Output format independent
| |
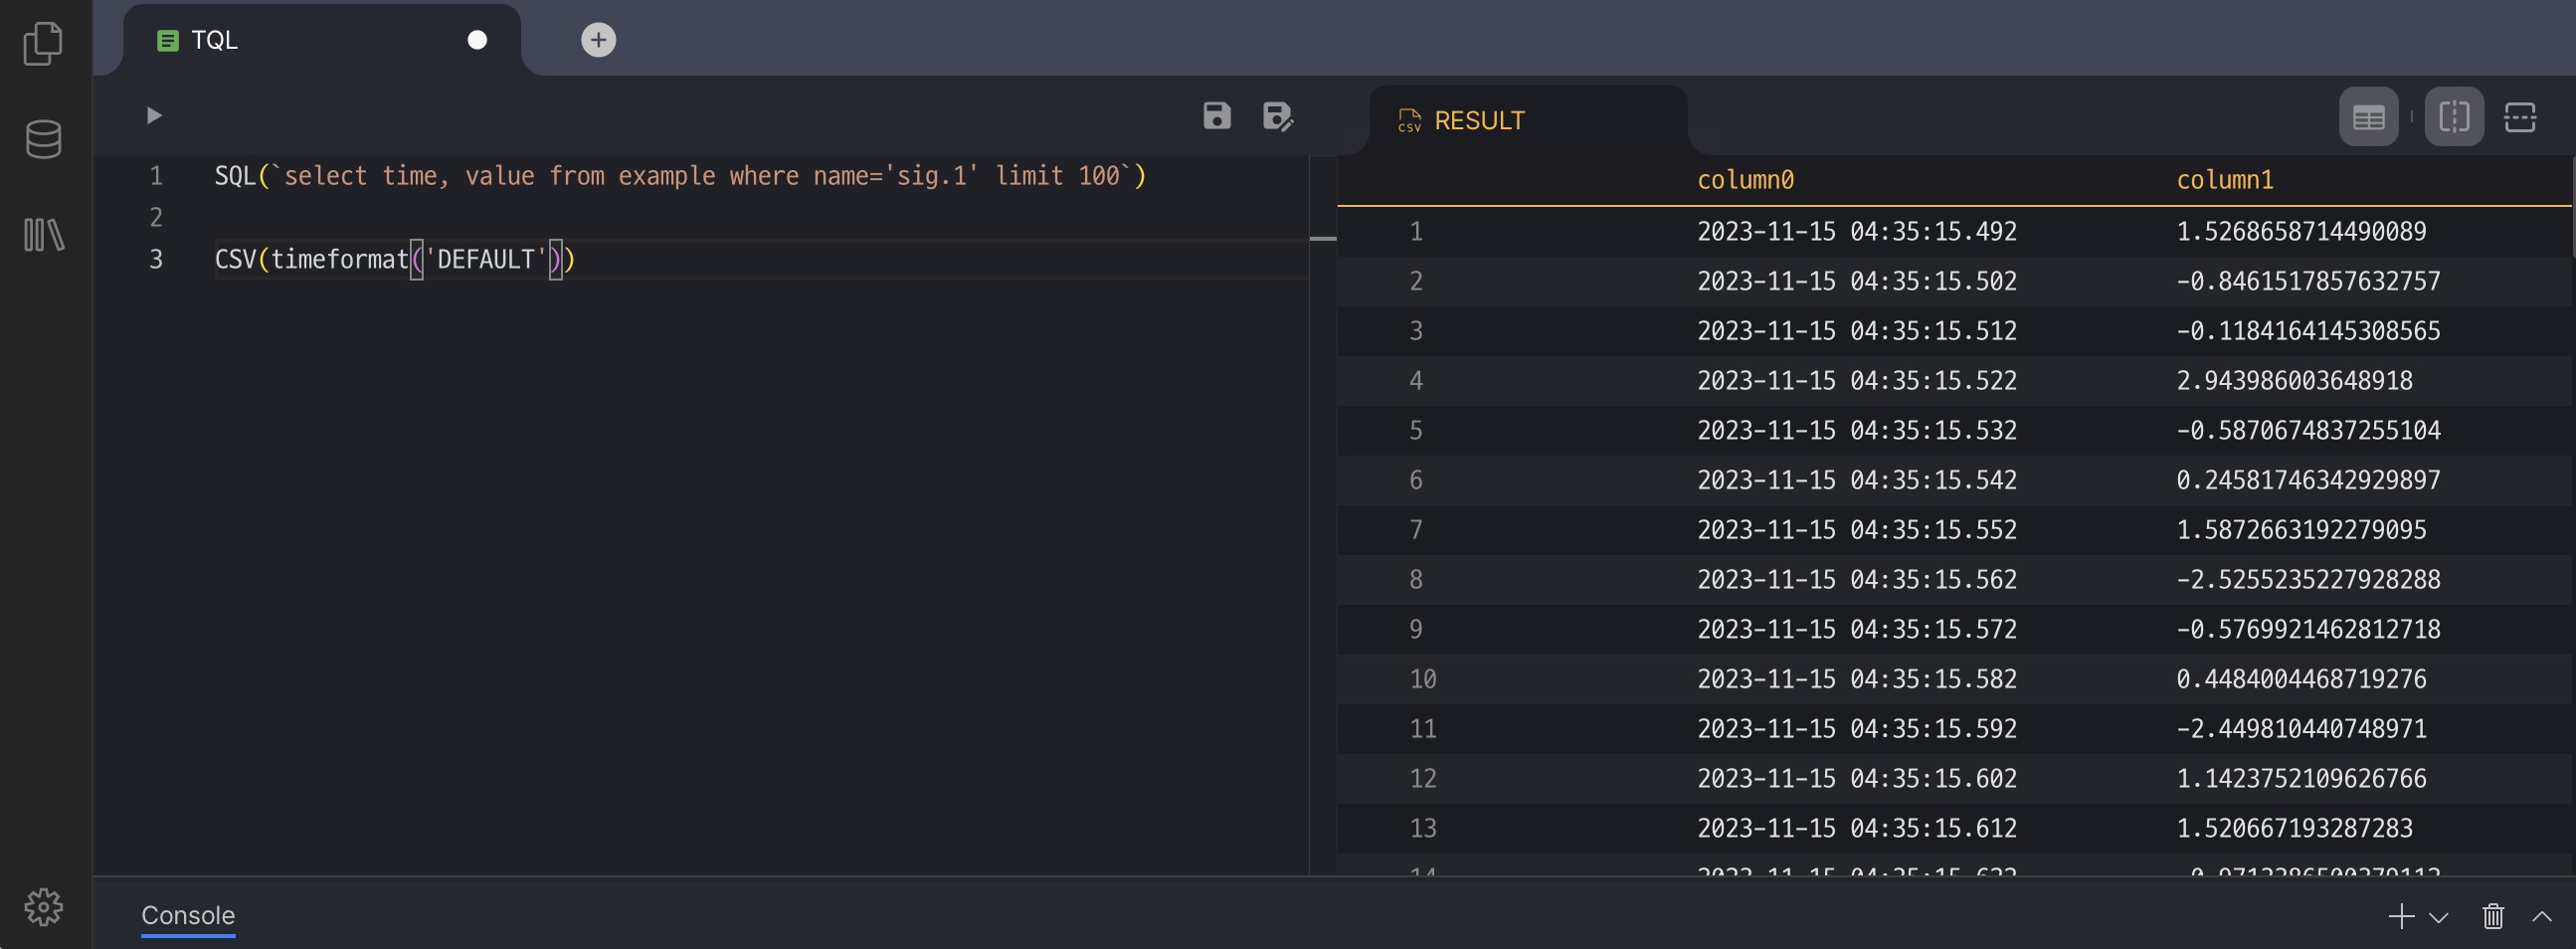
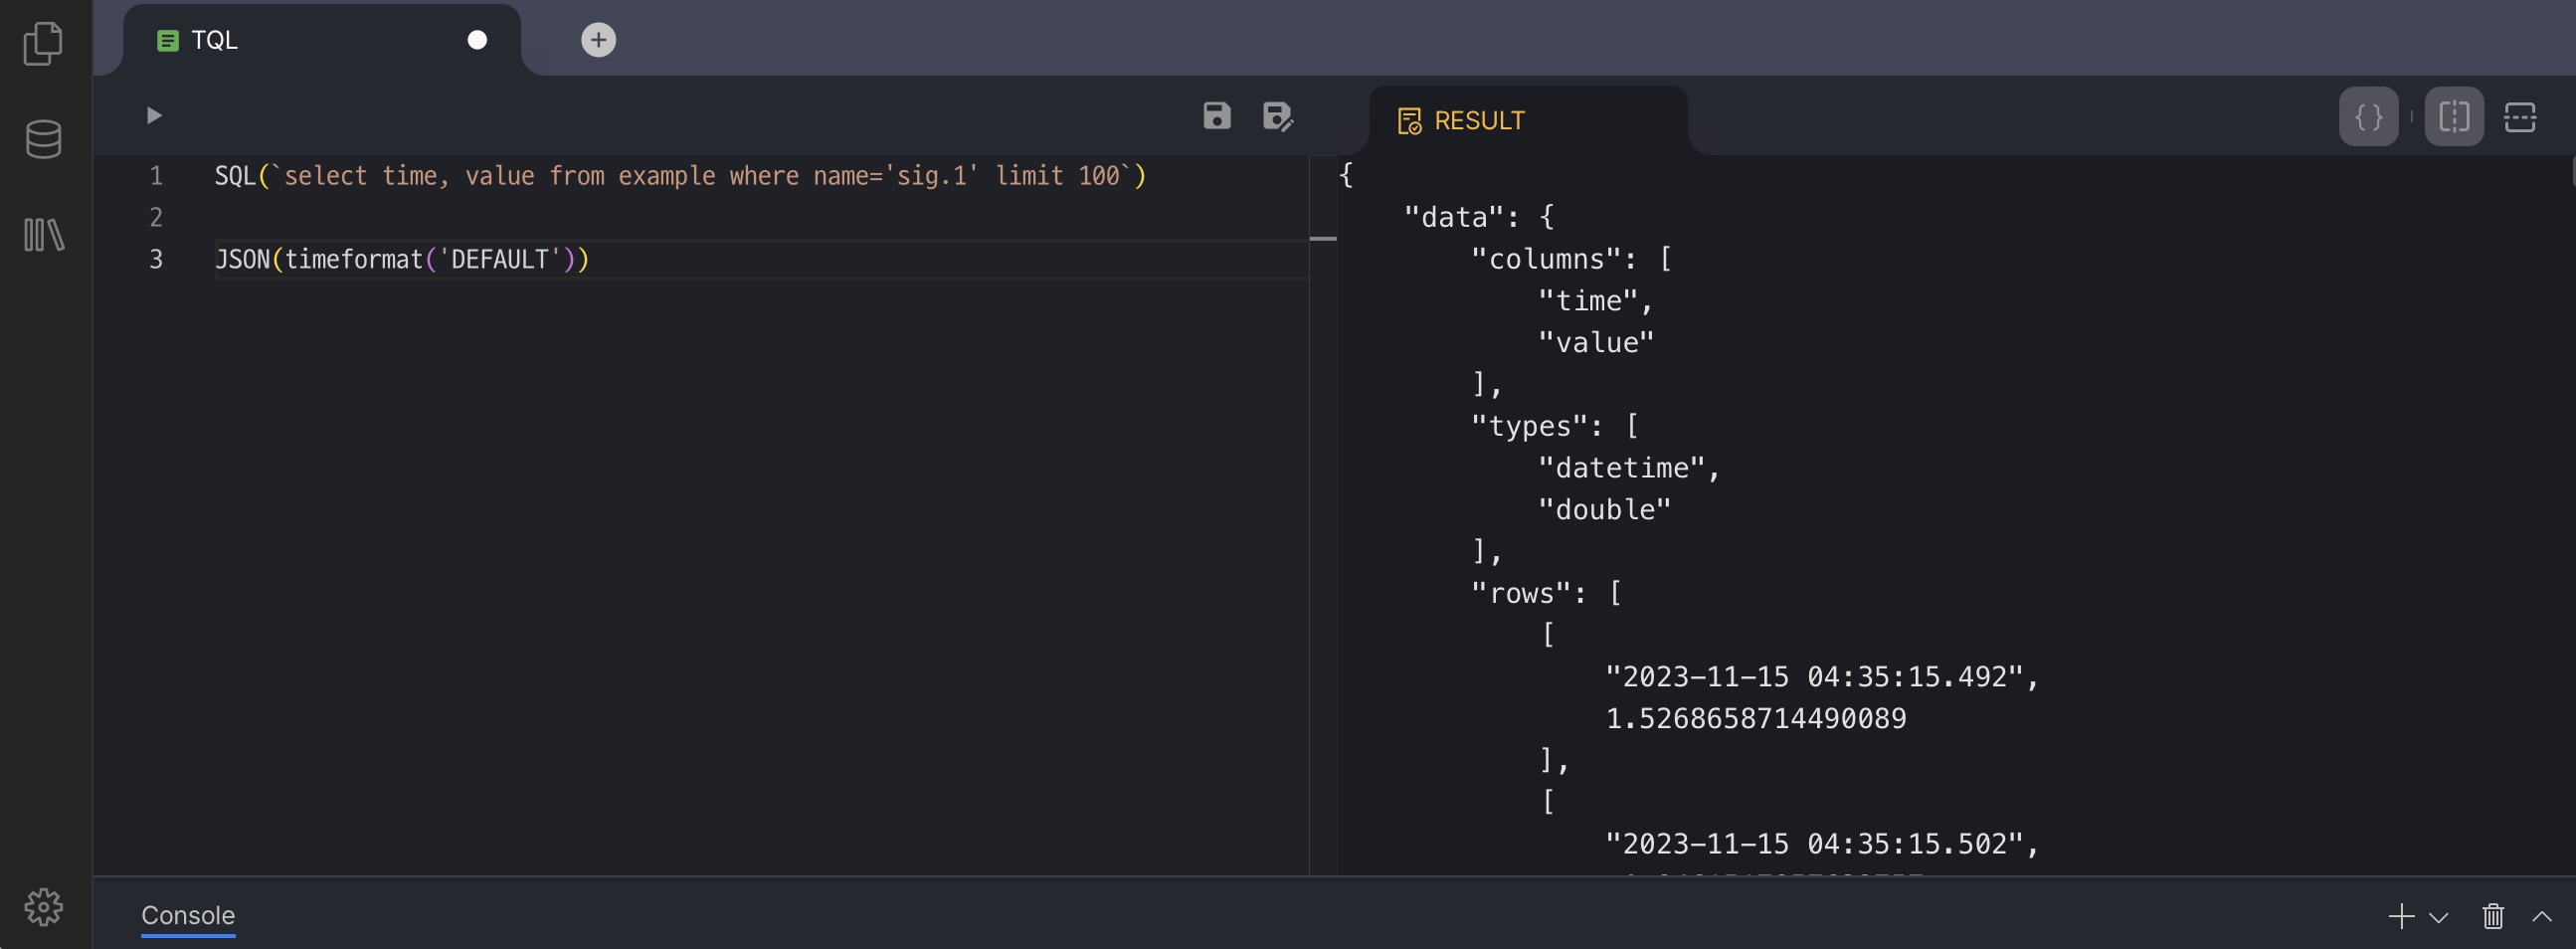
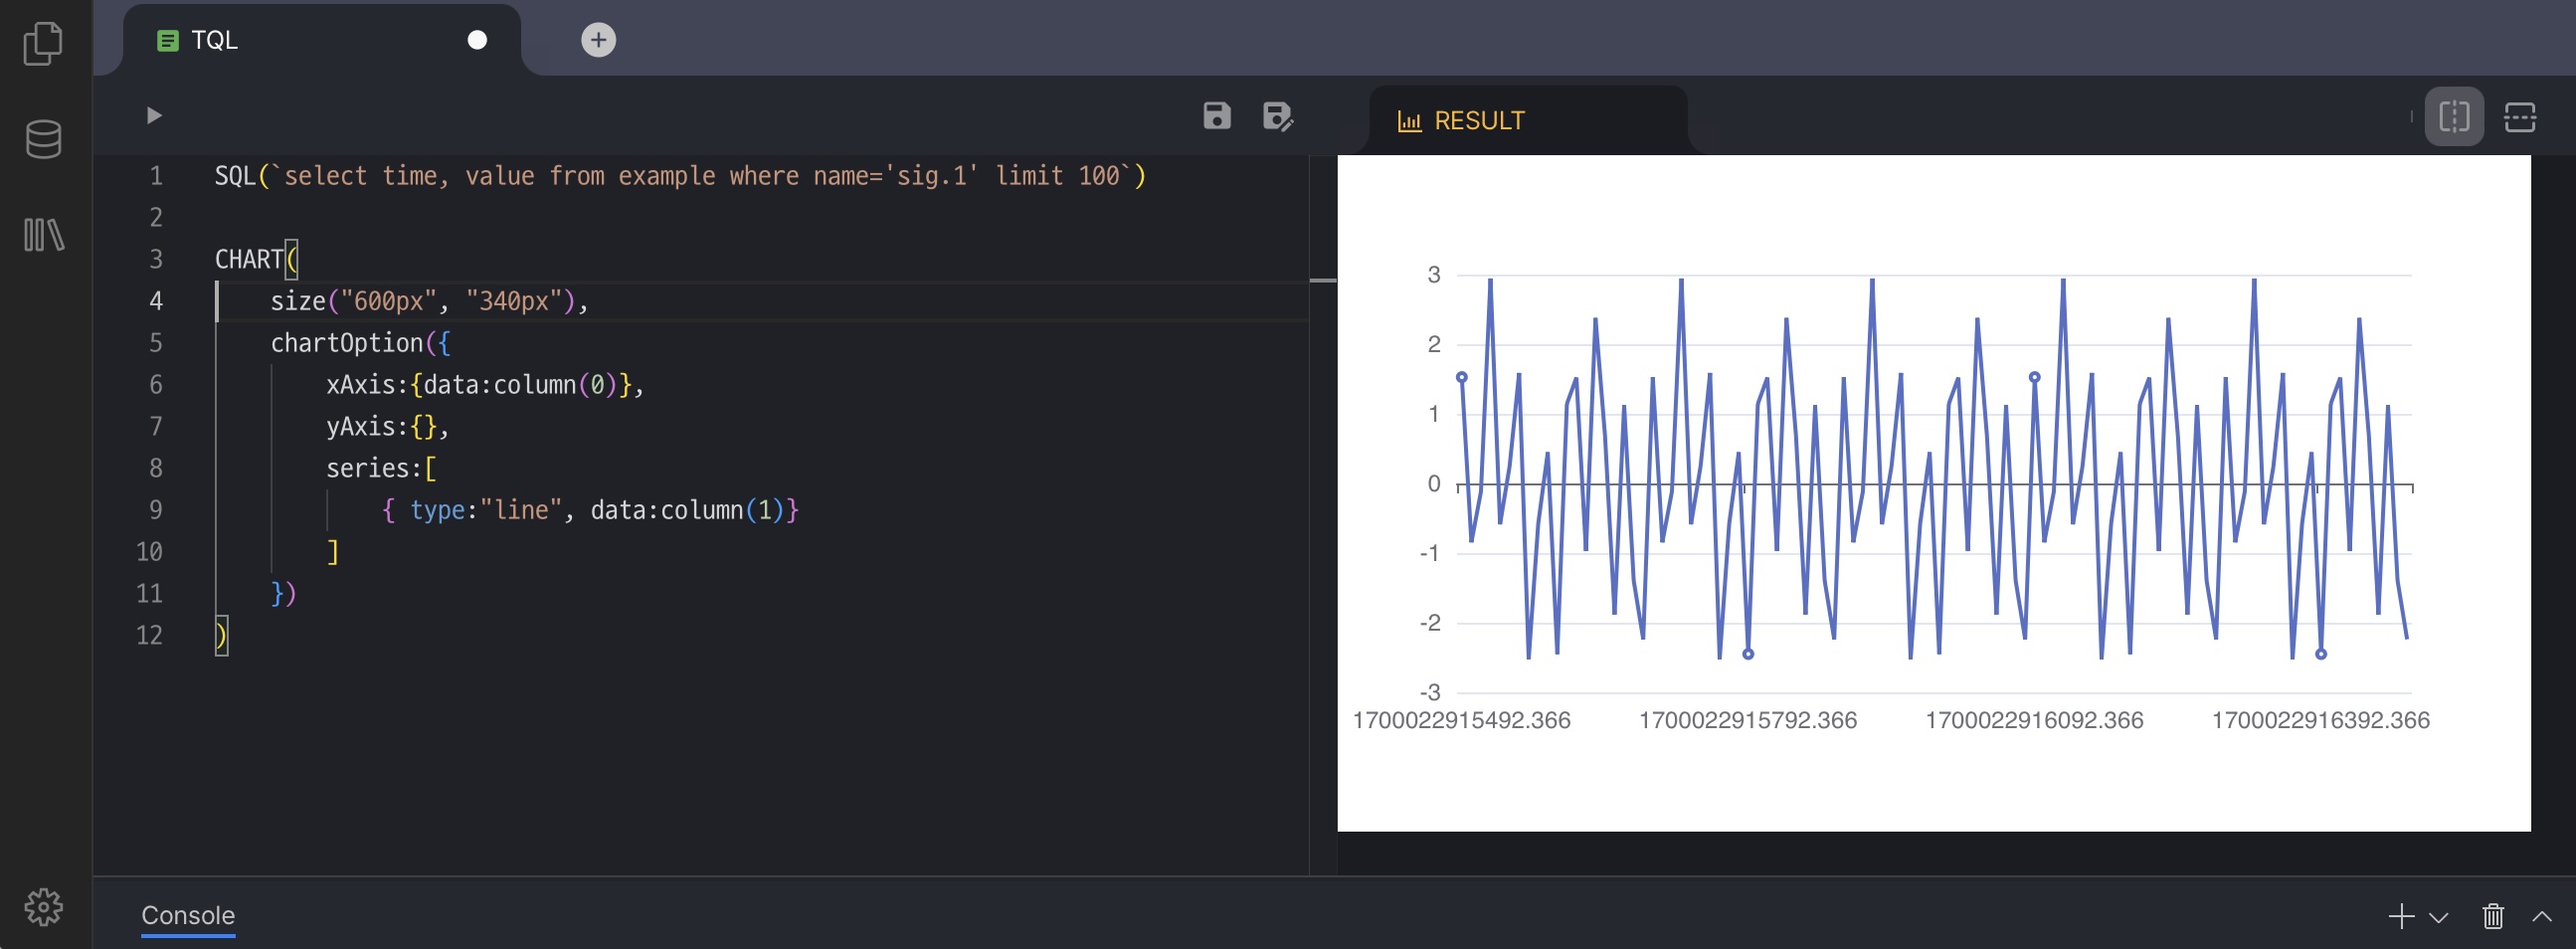
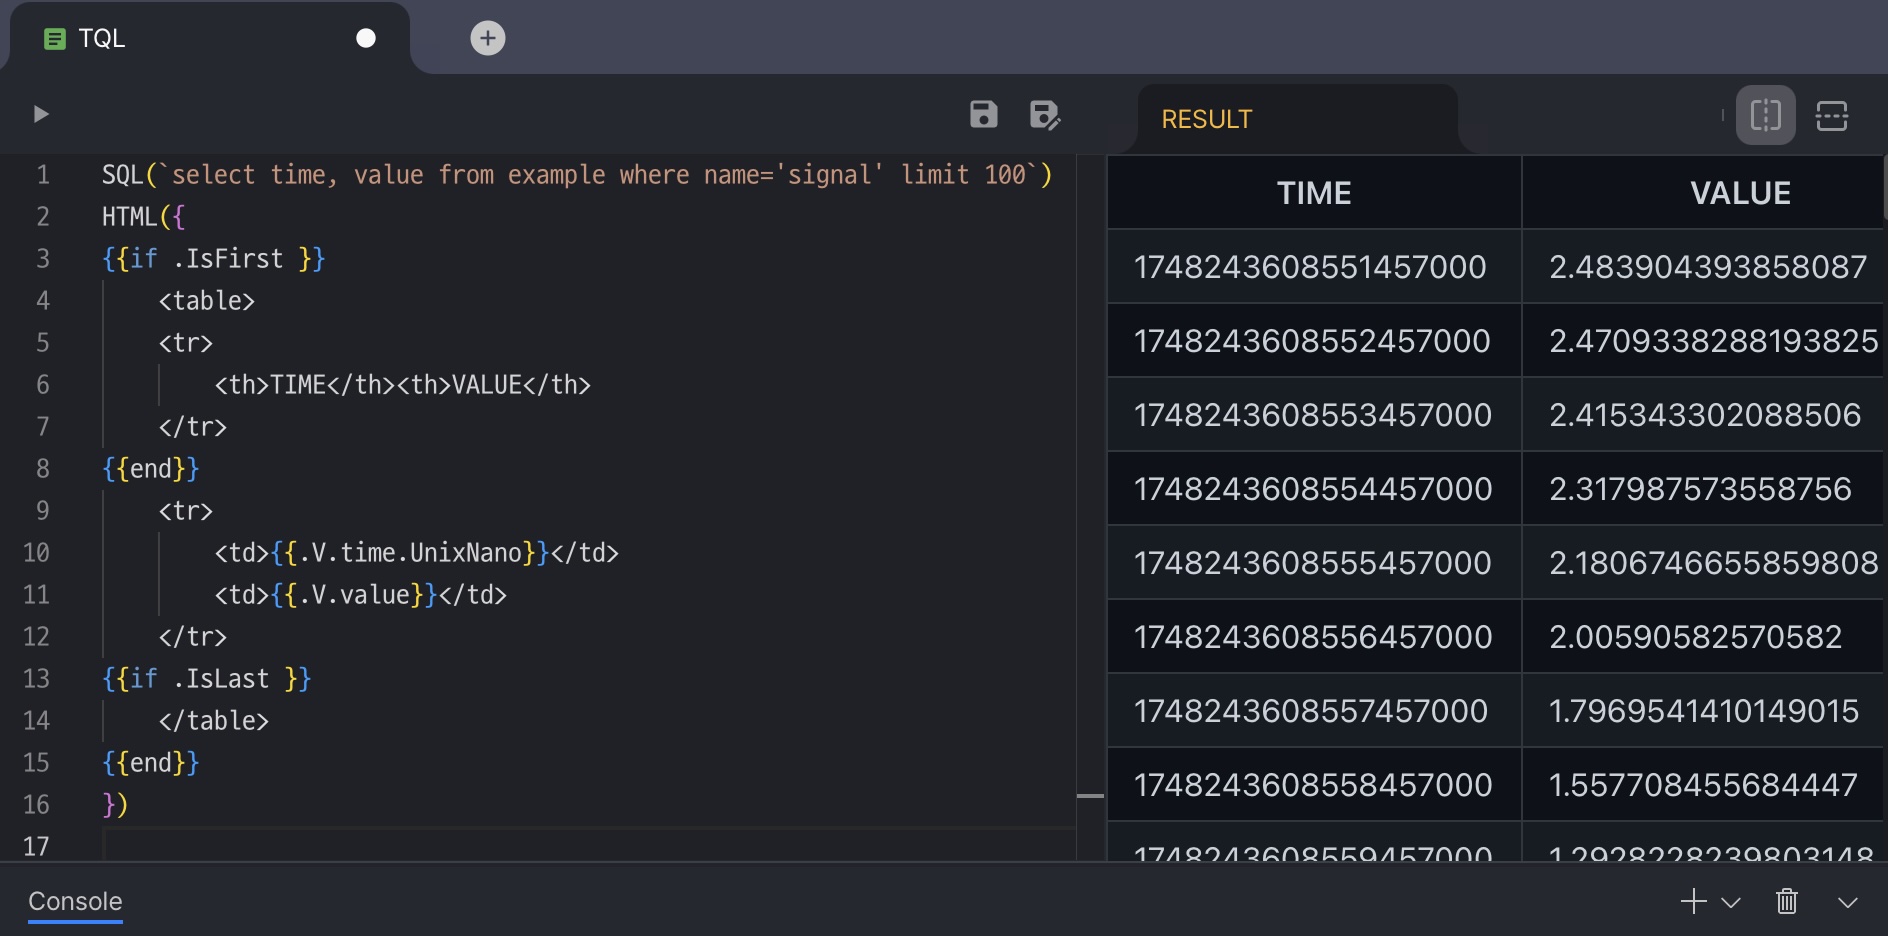
Data source independent
| |
The purpose of TQL is to transform data easily. This chapter shows how to process data into various formats without developing additional applications.
Iris Demo
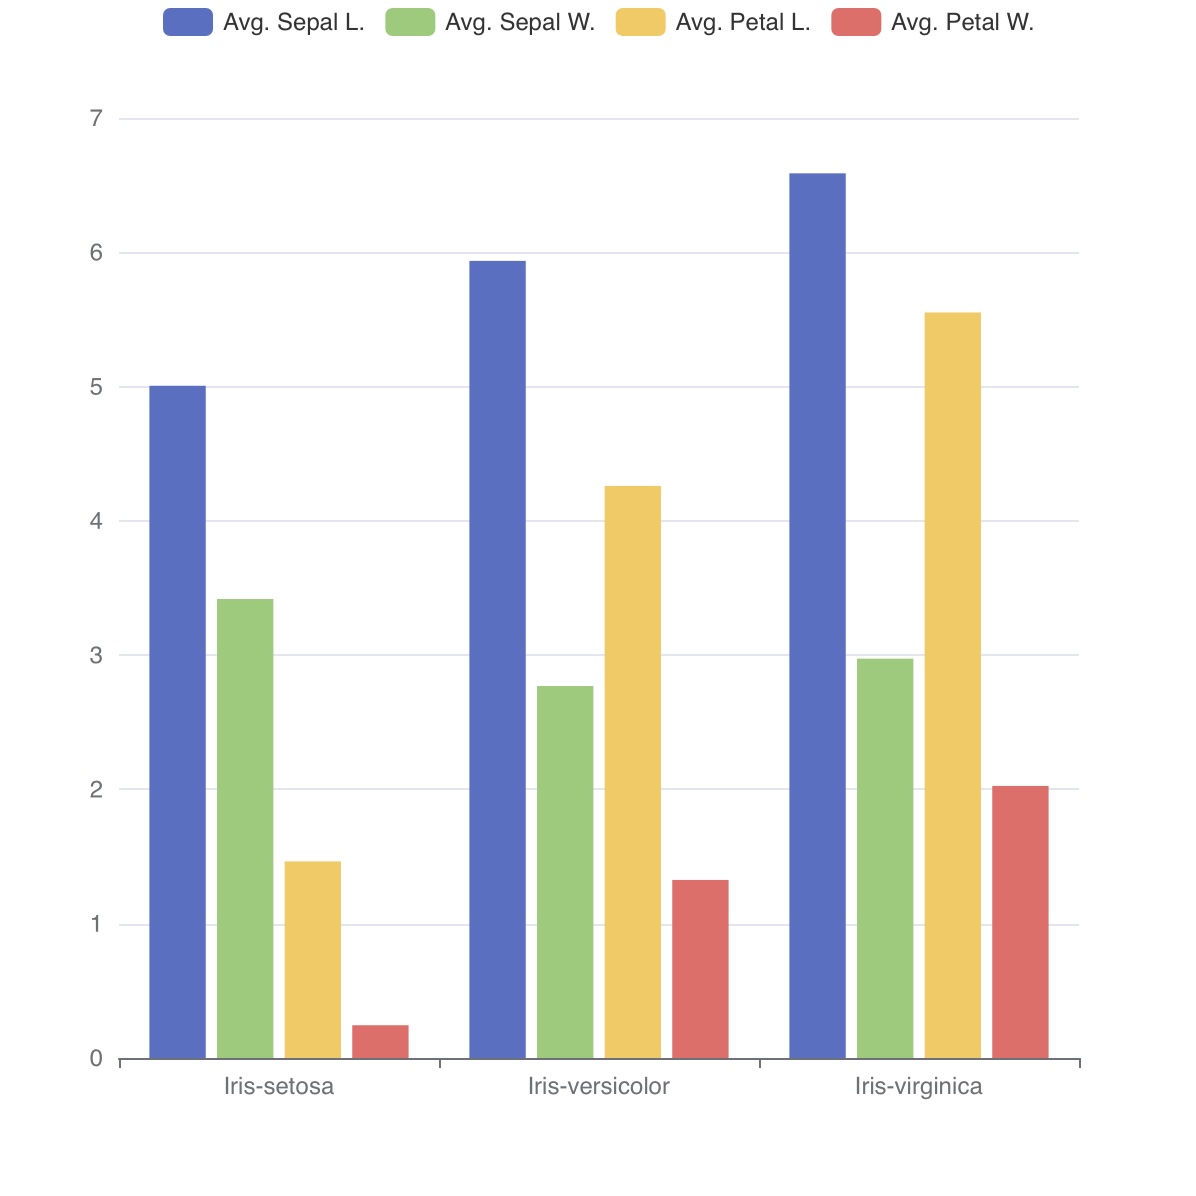
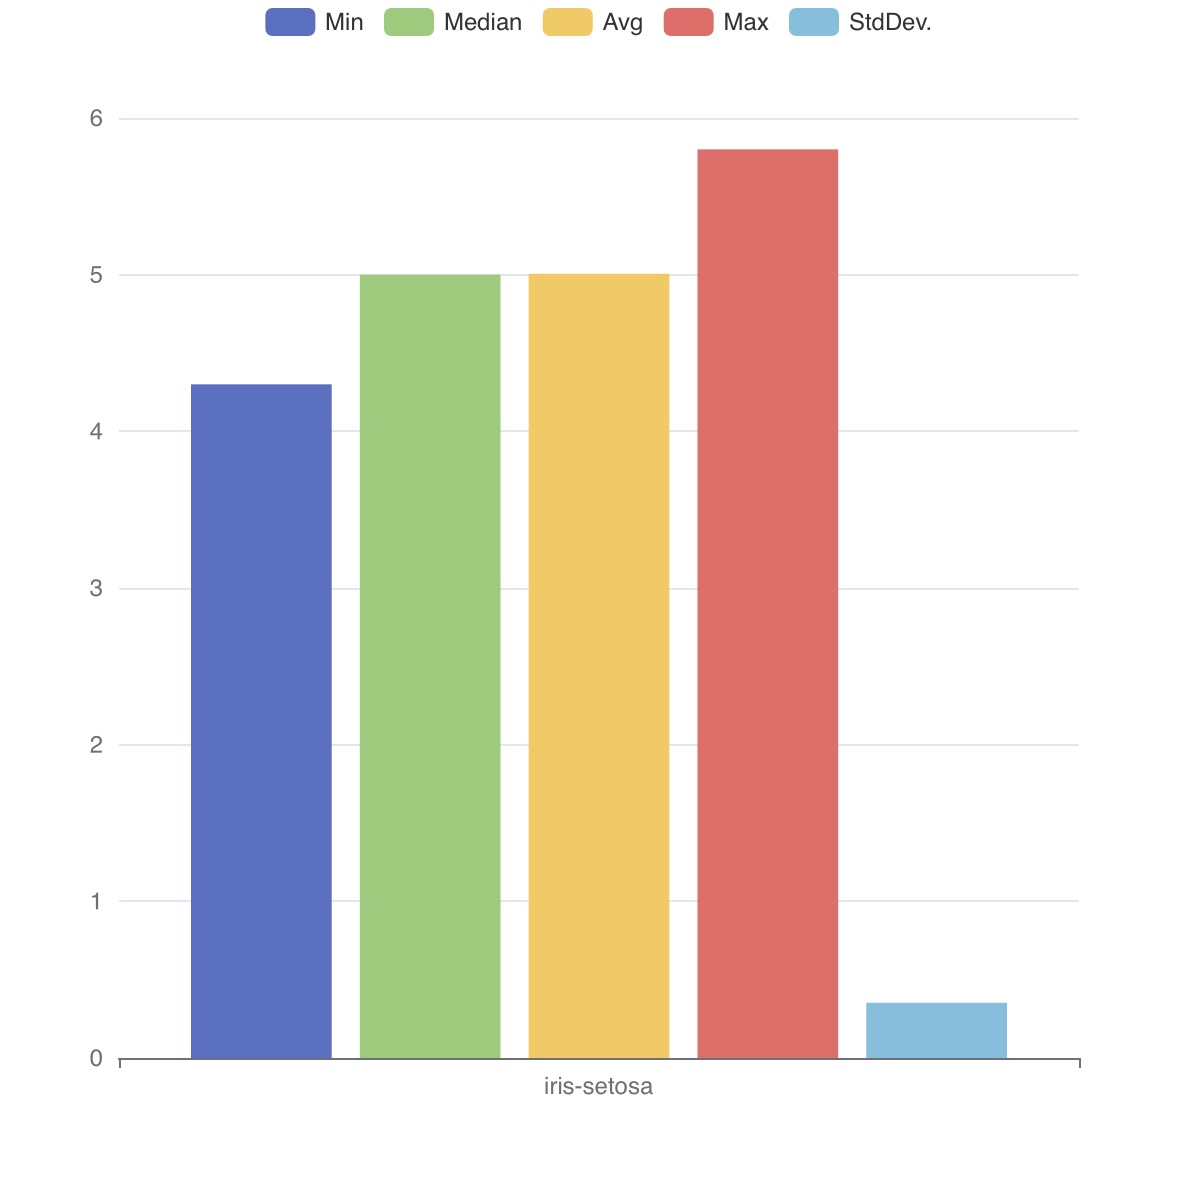
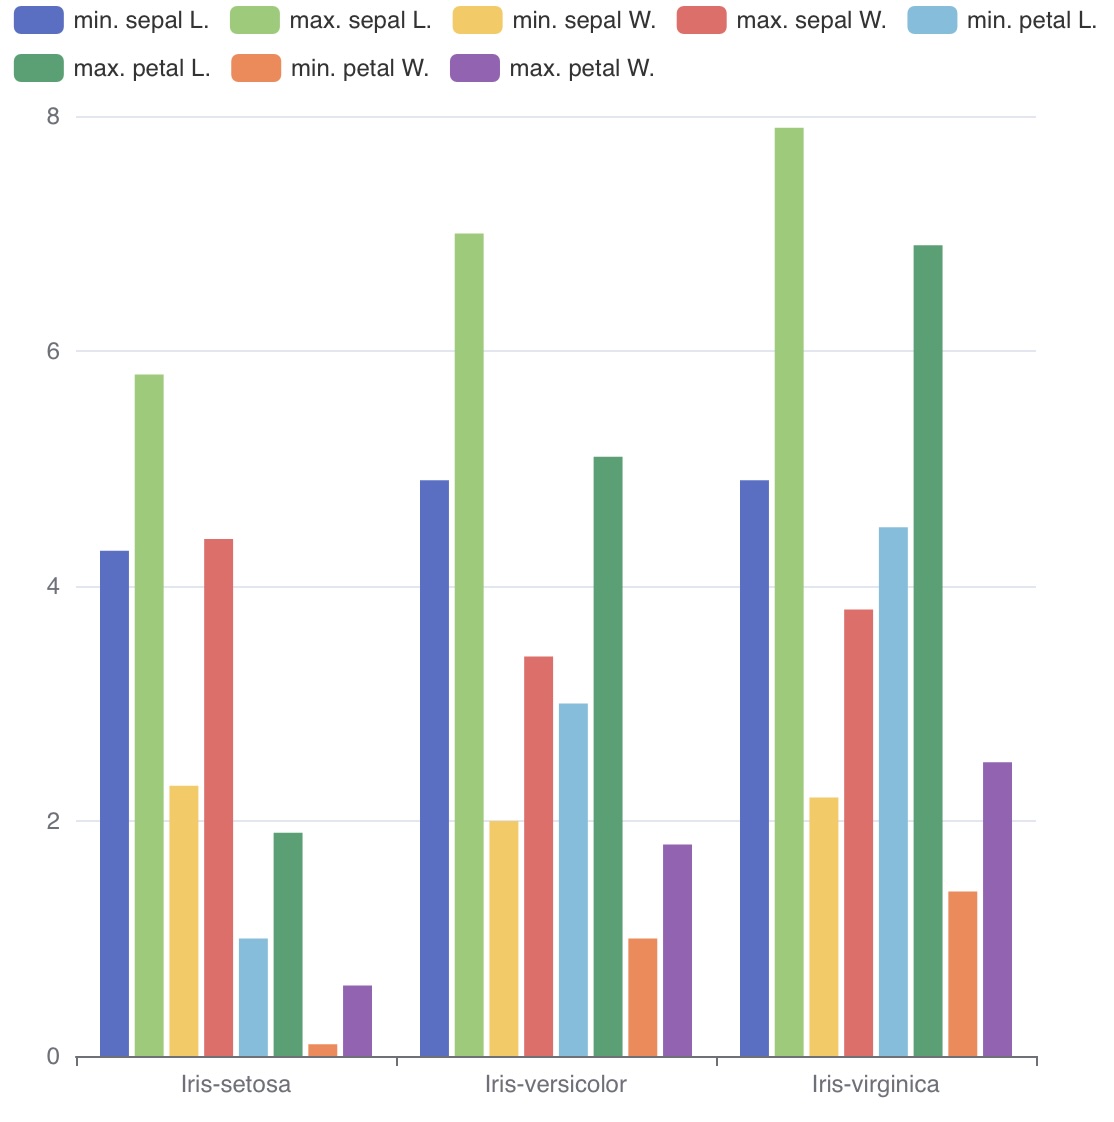
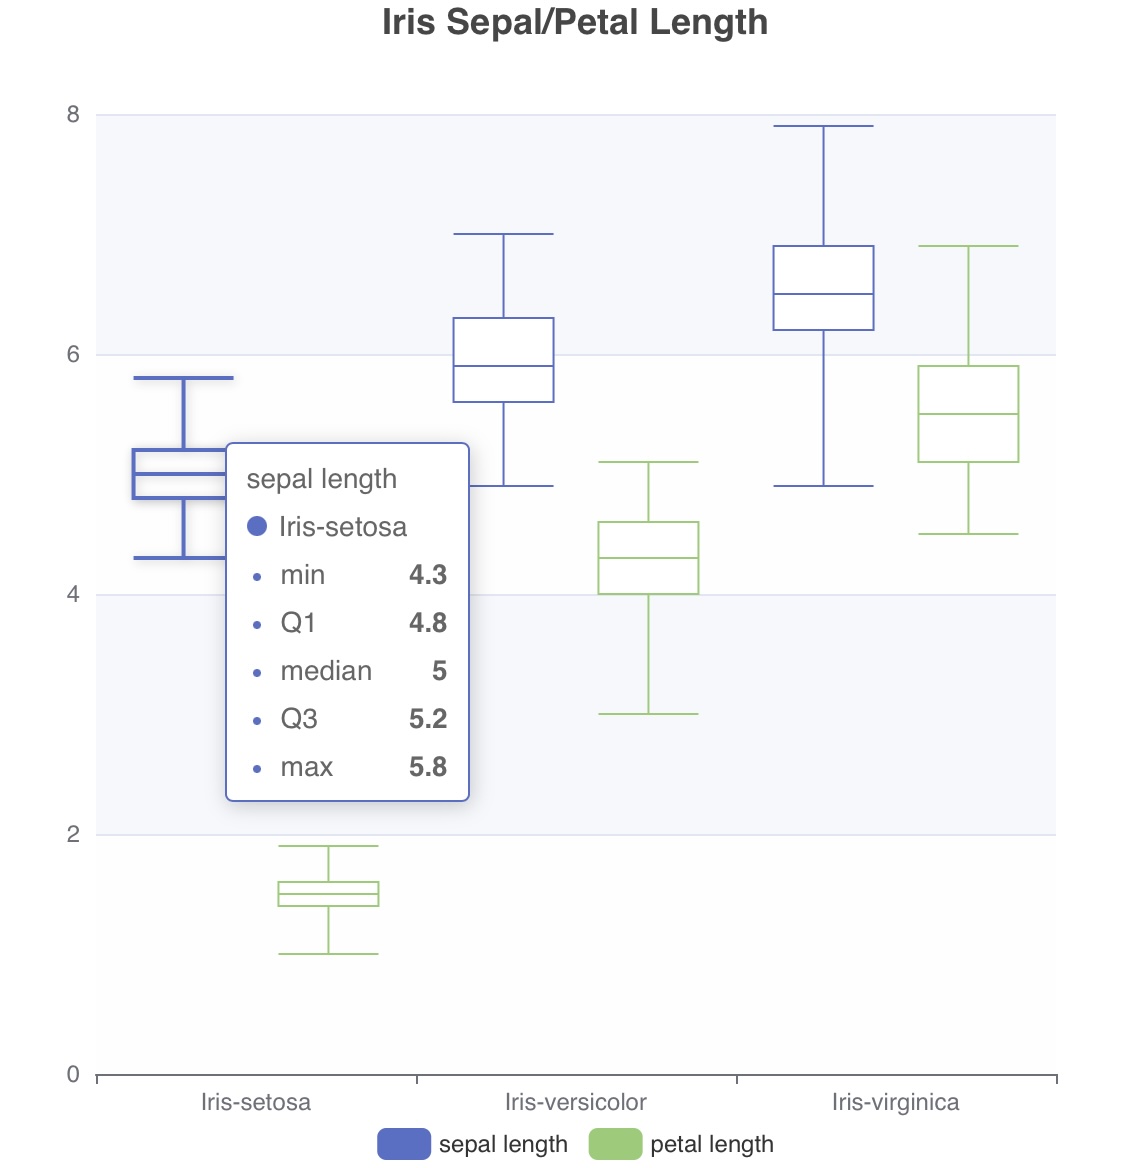
The Iris data examples below give a brief idea of what TQL is used for.
- Average values of each class
| |
In this chapter
Last updated on