CHART()
Syntax: CHART(chartOption() [,size()] [, theme()] [, chartJSCode()])
Since v8.0.8
Options
chartOption()
Syntax: chartOption( { json in apache echarts options } )
chartJSCode()
Syntax: chartJSCode( { user javascript code } )
size()
Syntax: size(width, height)
widthstring chart width in HTML syntax ex)'800px'heightstring chart height in HTML syntax ex)'800px'
theme()
Syntax: theme(name)
namestring theme name
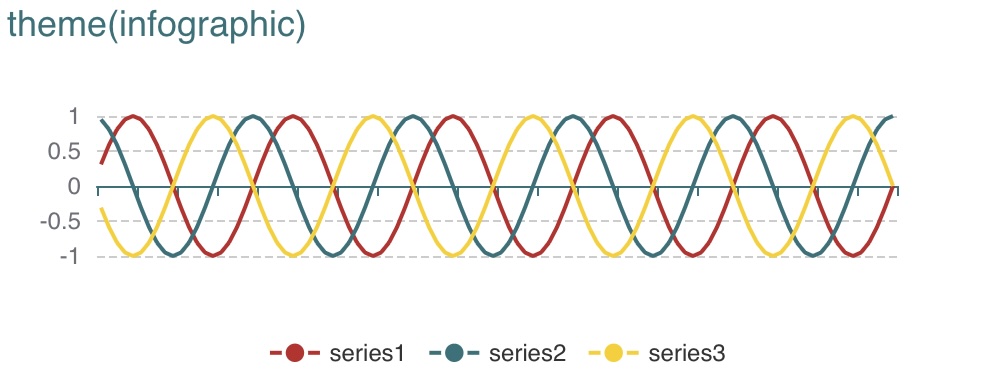
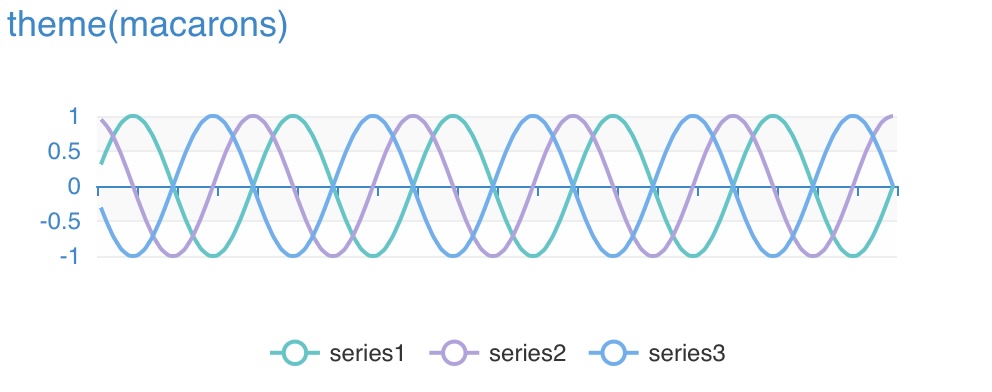
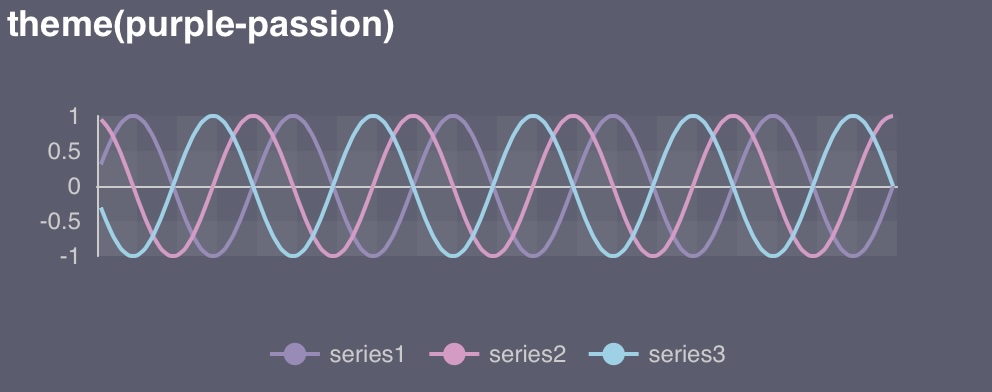
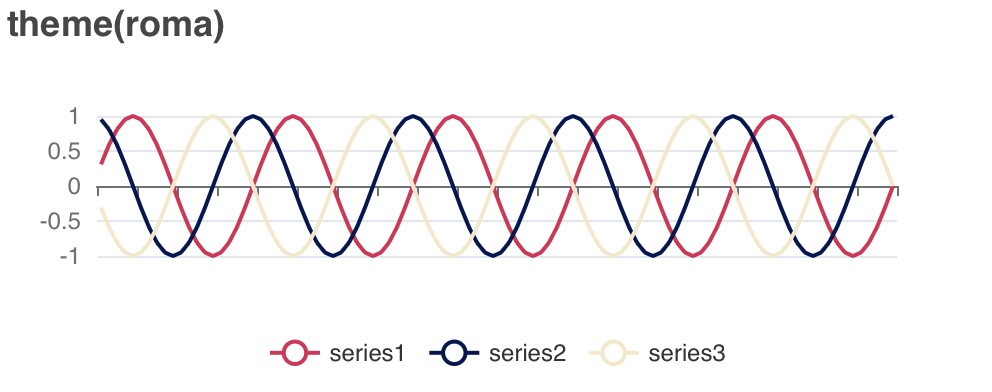
Apply a chart theme.
Available themes: white, dark, chalk, essos, infographic, macarons, purple-passion, roma, romantic, shine, vintage, walden, westeros, wonderland
Refer to the section below for a preview of each theme.
plugins()
Syntax: plugins(plugin...)
pluginstring pre-defined plugin name or url of plugin module.
| Pre-defined plugin | Actual module url |
|---|---|
| liquidfill | /web/echarts/echarts-liquidfill.min.js |
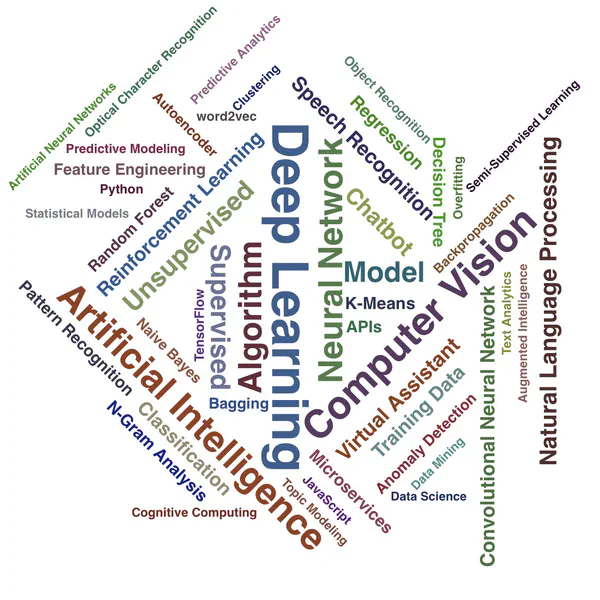
| wordcloud | /web/echarts/echarts-wordcloud.min.js |
| gl | /web/echarts/echarts-gl.min.js |
Examples
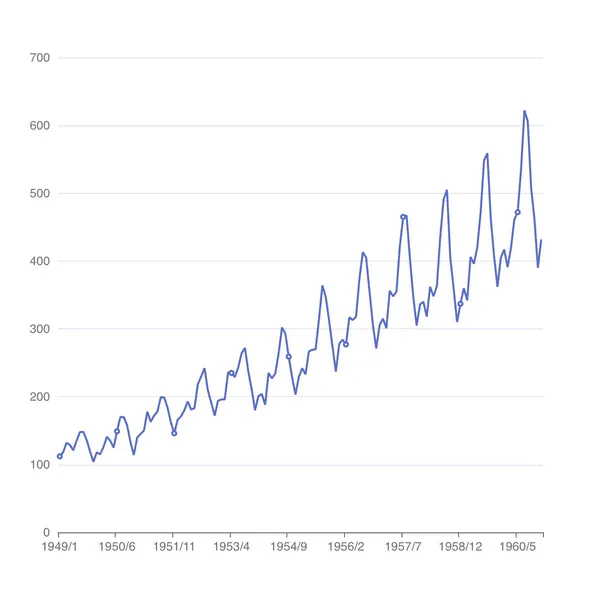
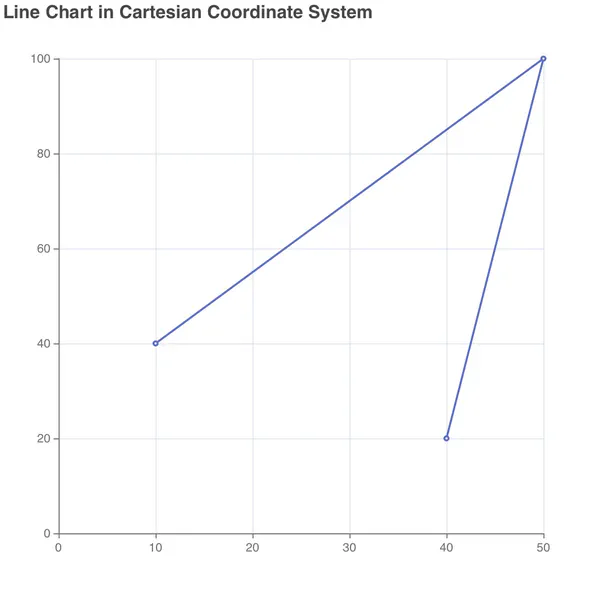
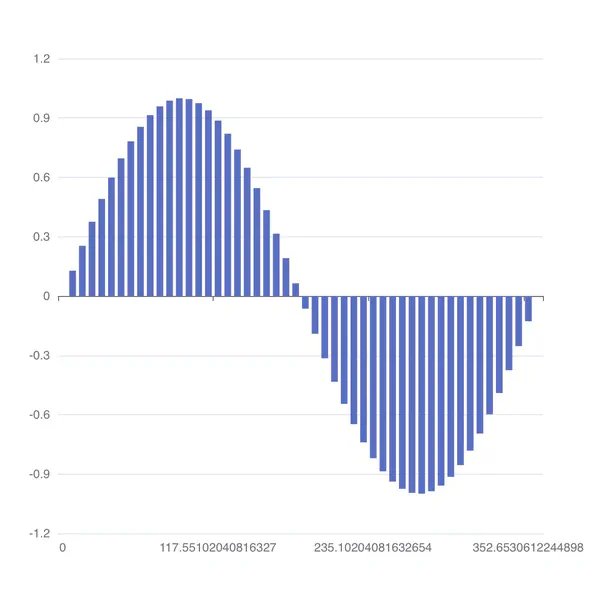
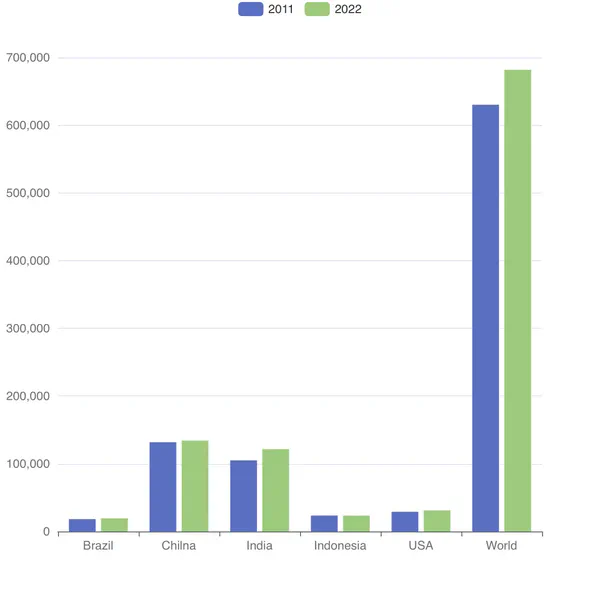
The new CHART() provides more fine-tunable options to create attractive charts.
It is the new version of the API that replaces the previous CHART_LINE(), CHART_BAR(), CHART_SCATTER(), CHART_LINE3D(), CHART_BAR3D() and CHART_SCATTER3D() functions.
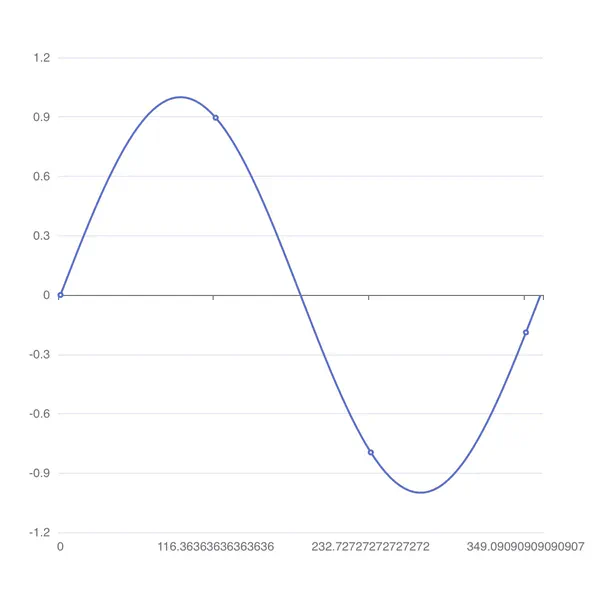
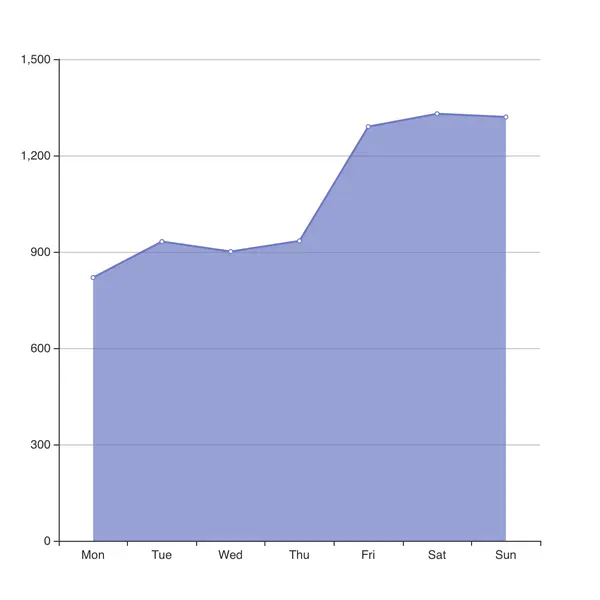
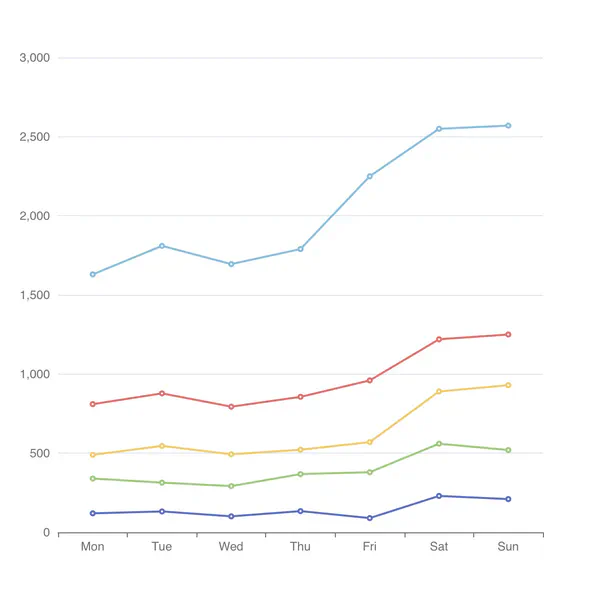
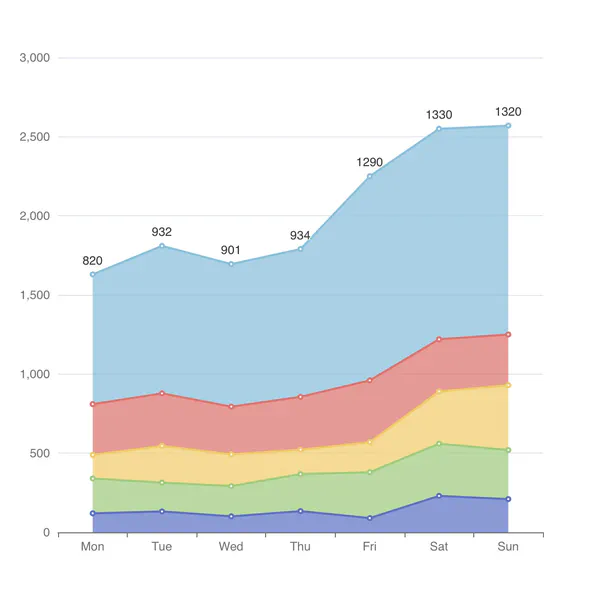
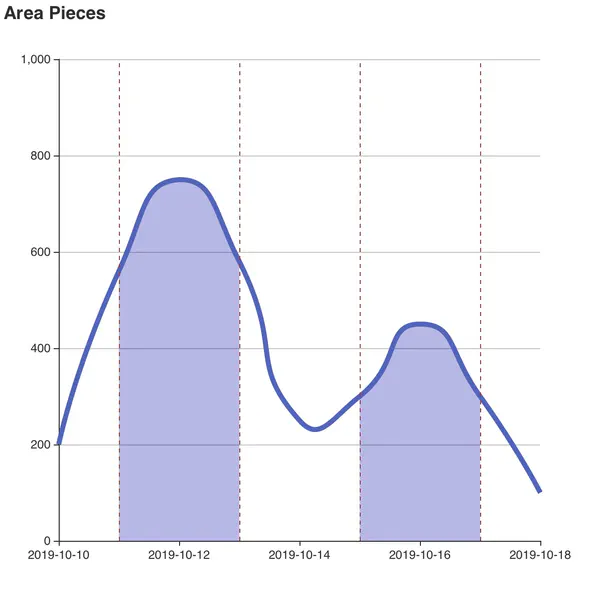
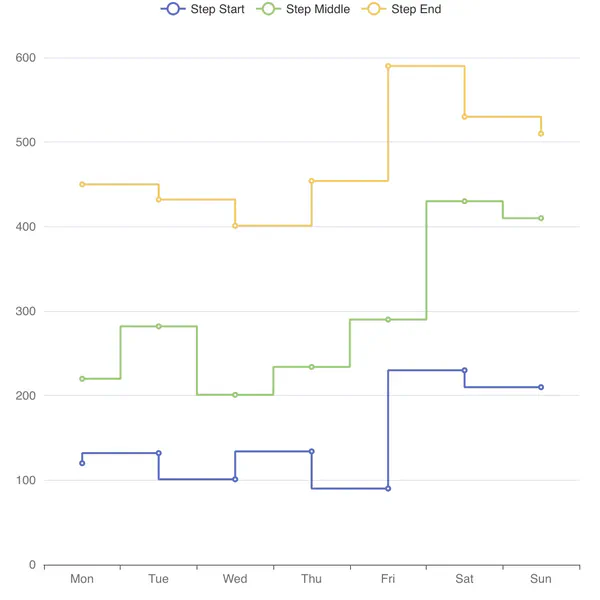
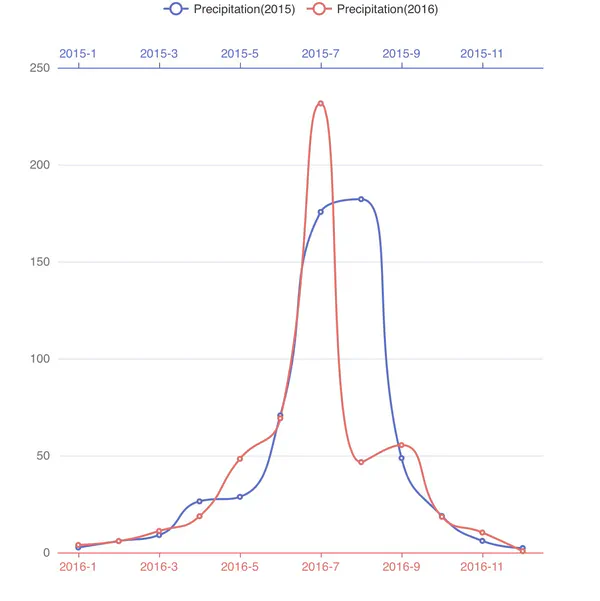
Line
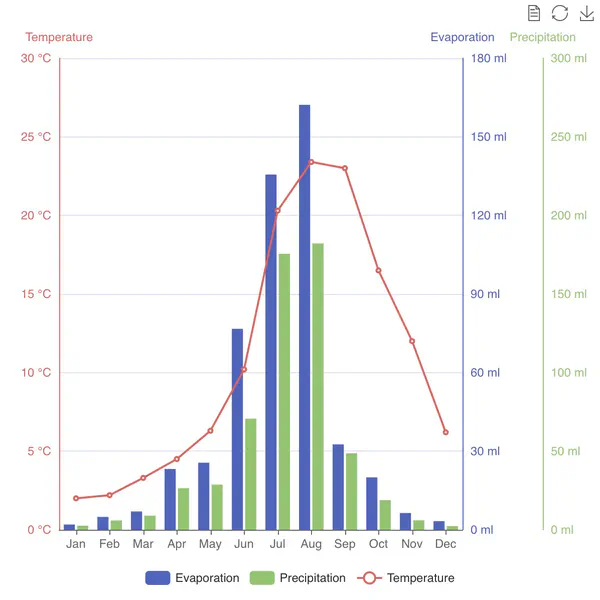
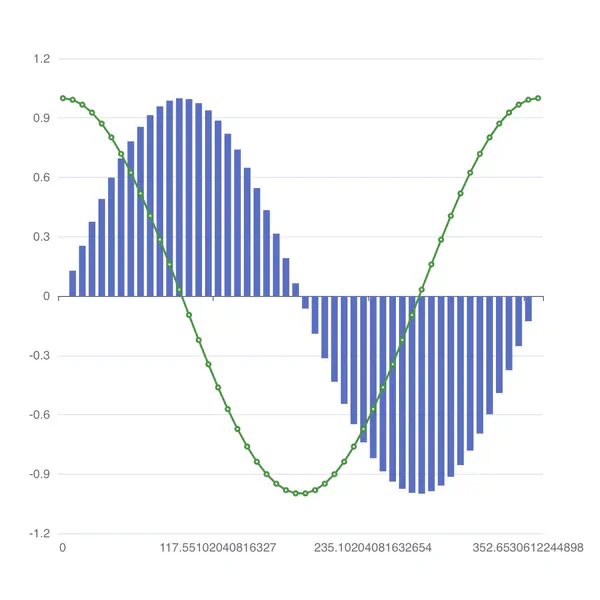
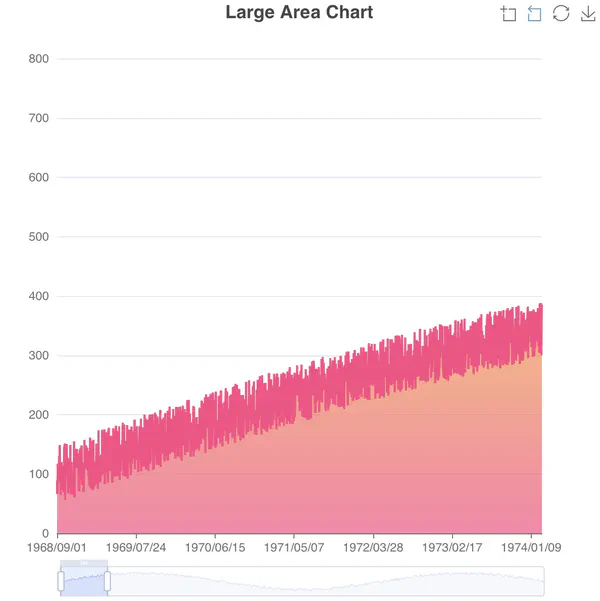
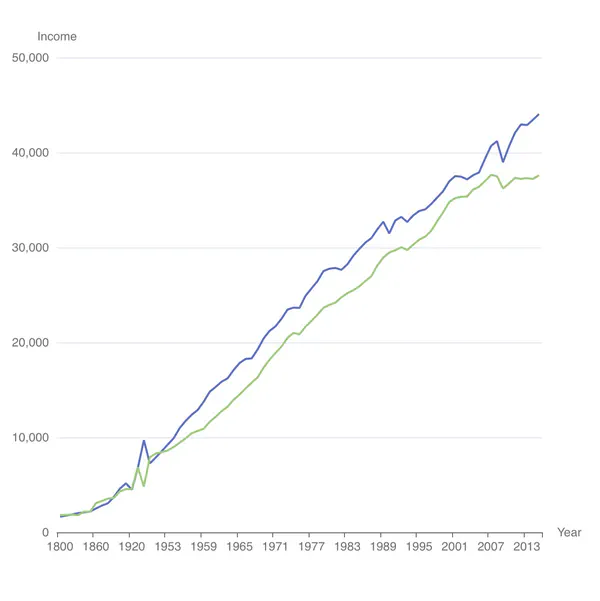
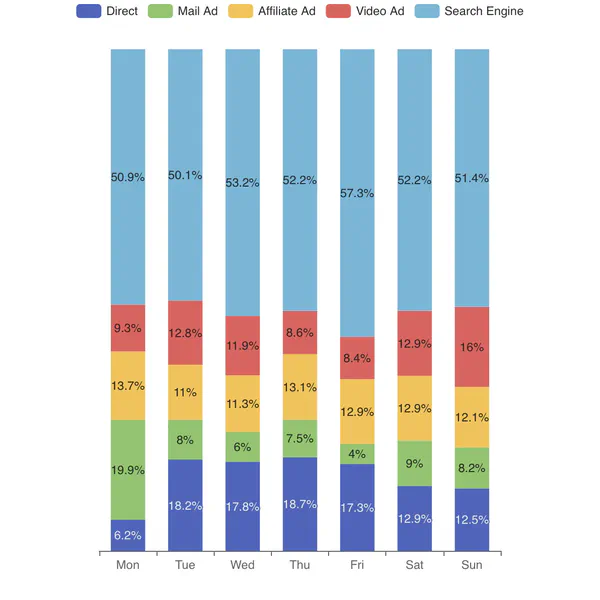
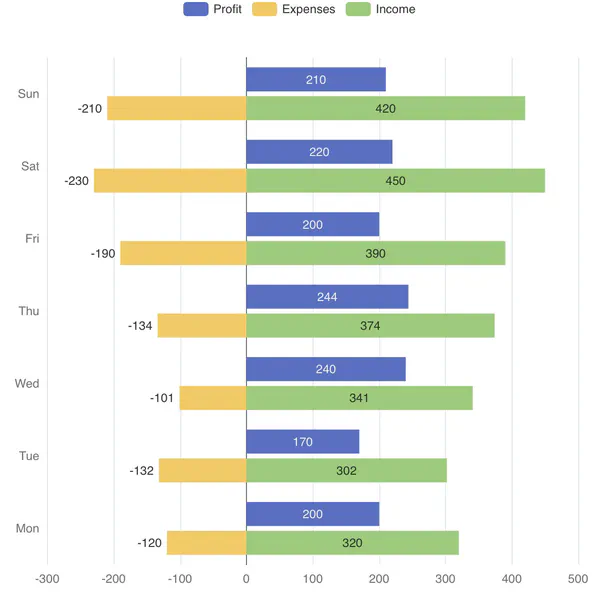
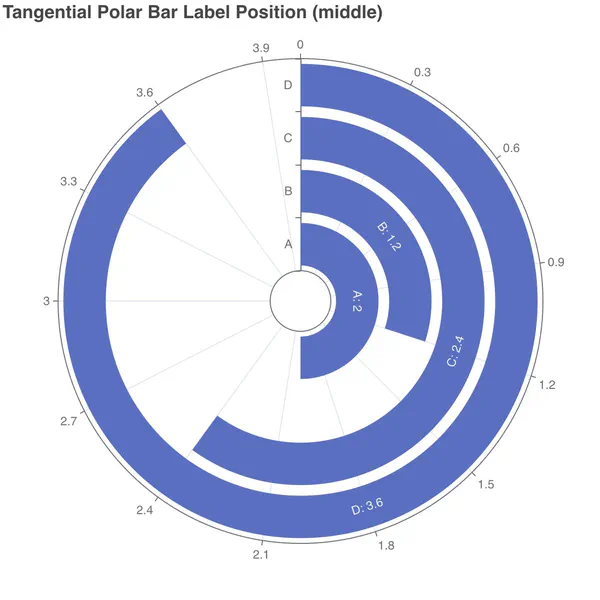
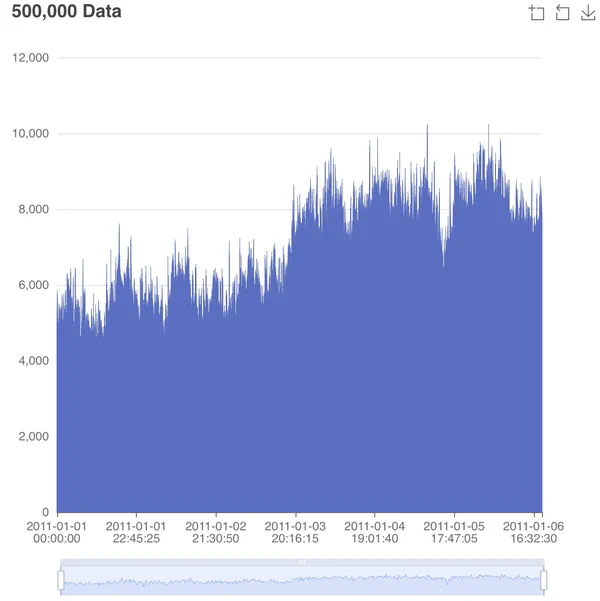

Bar
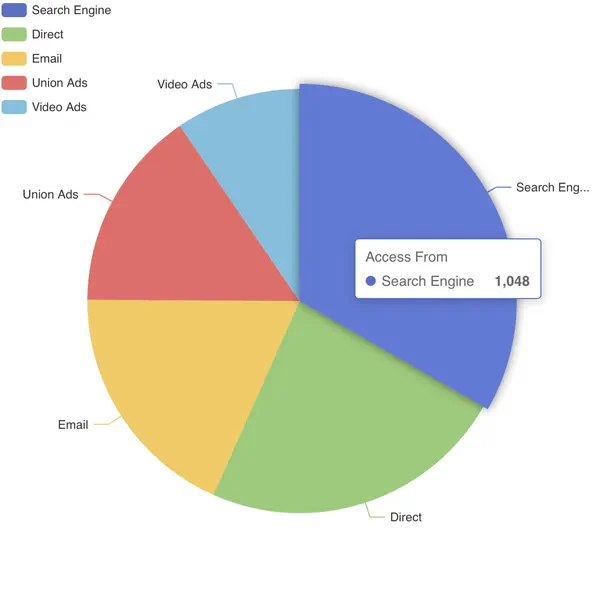
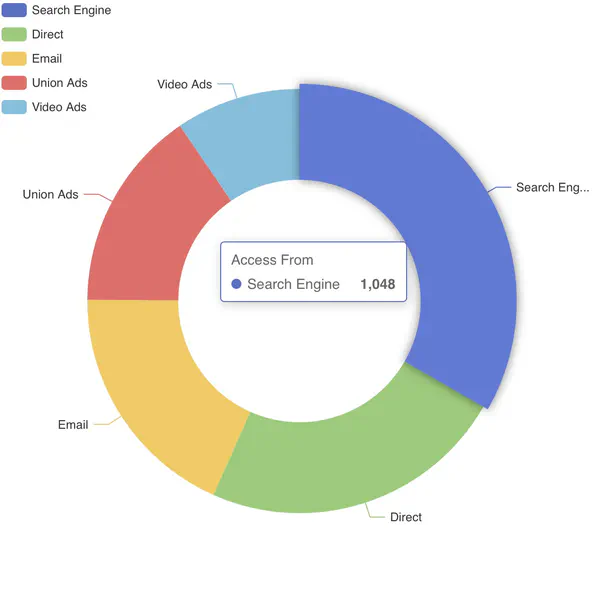
Pie
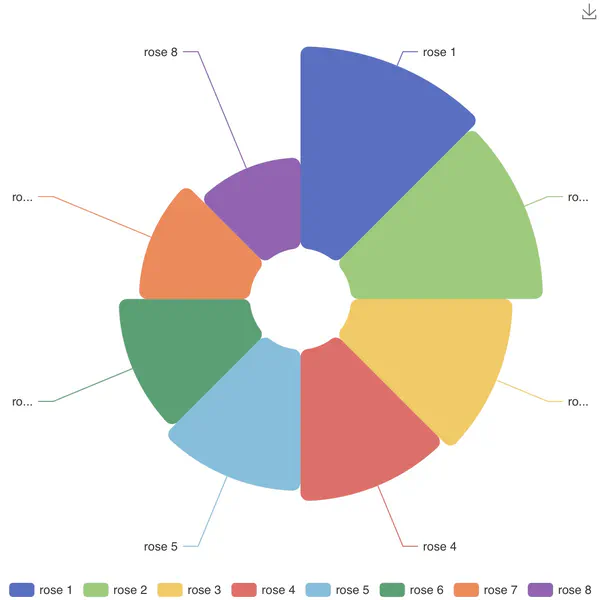
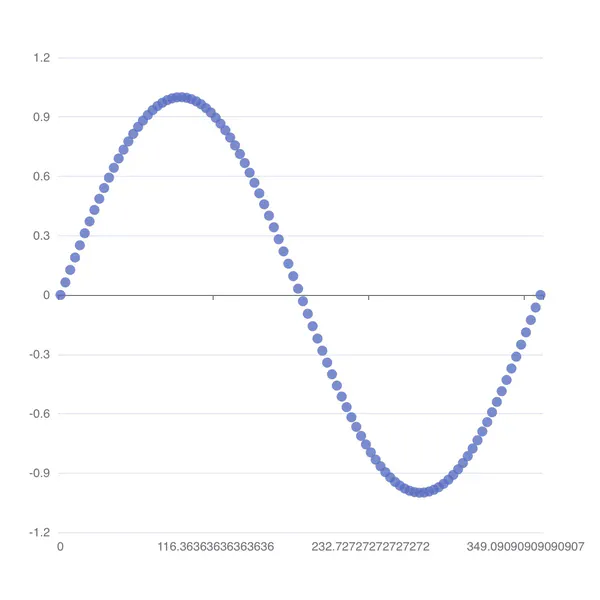
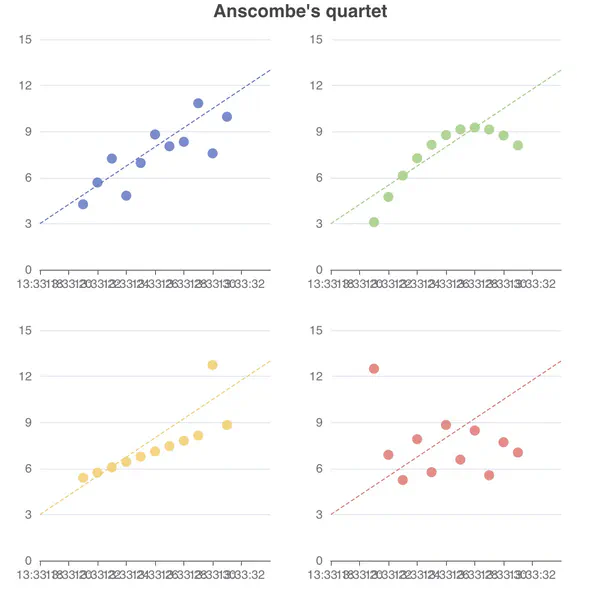
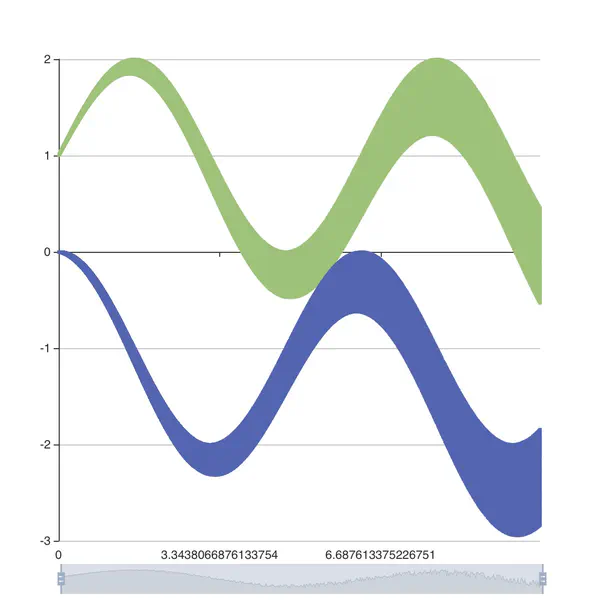
Scatter
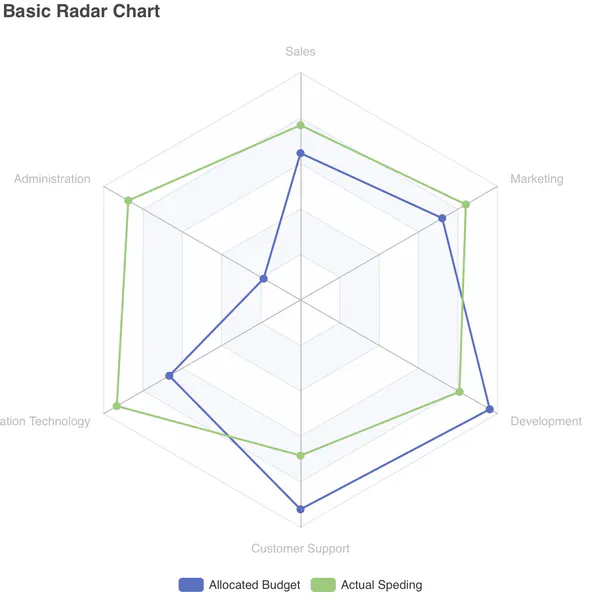
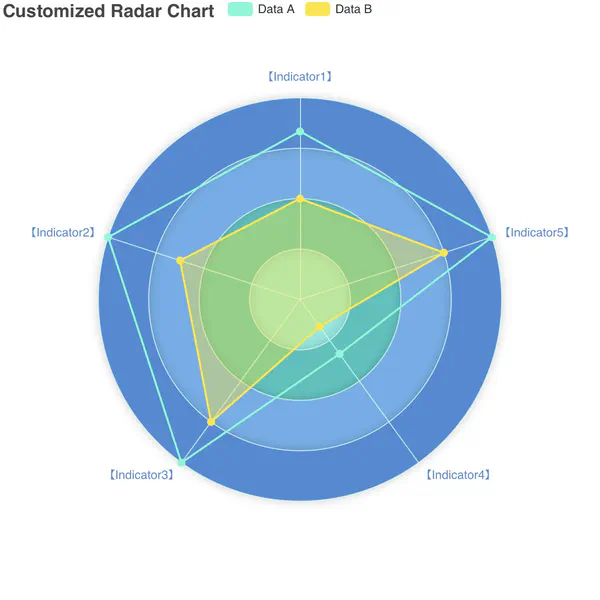
Radar
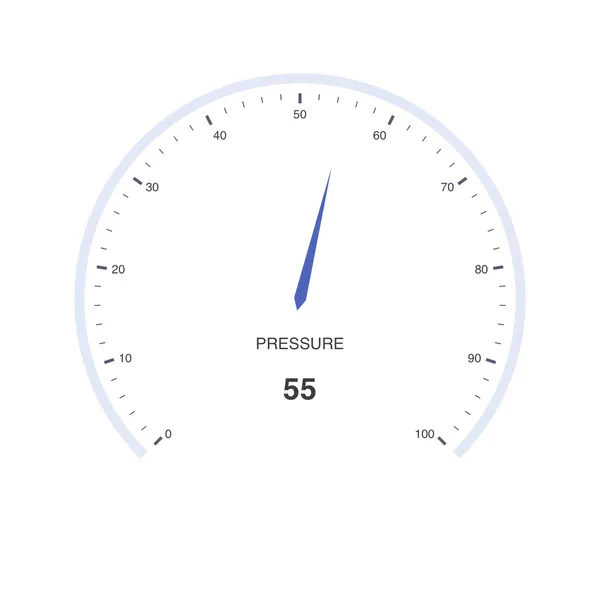
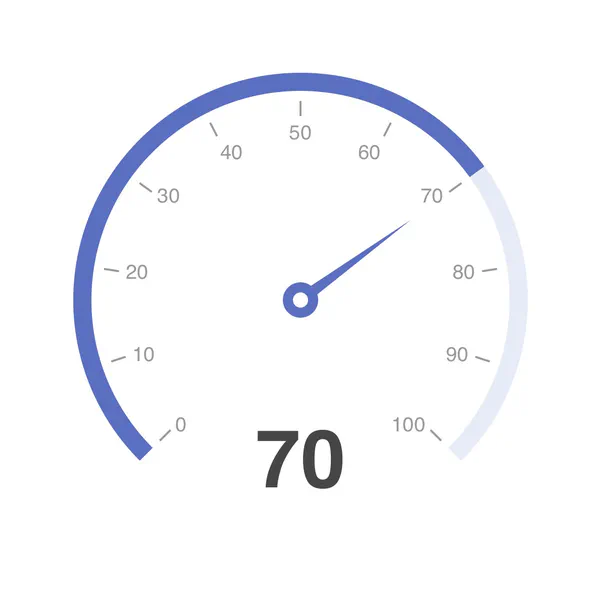

Gauge
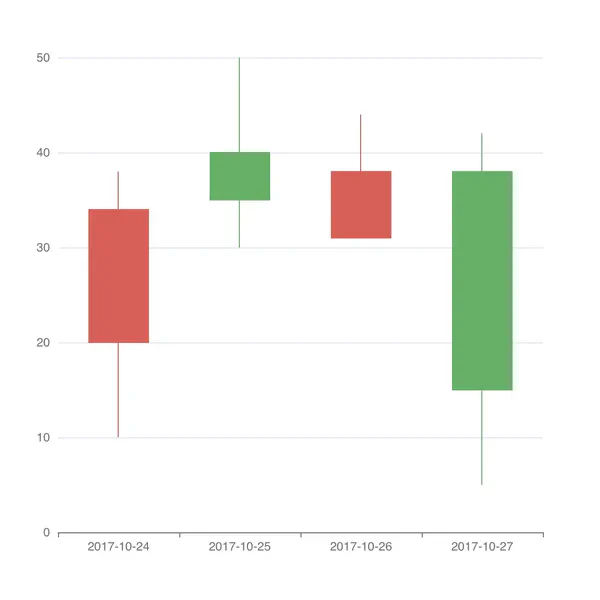
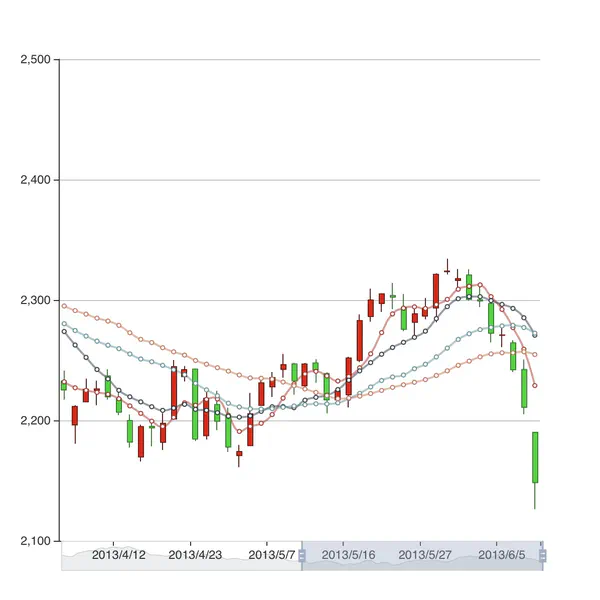
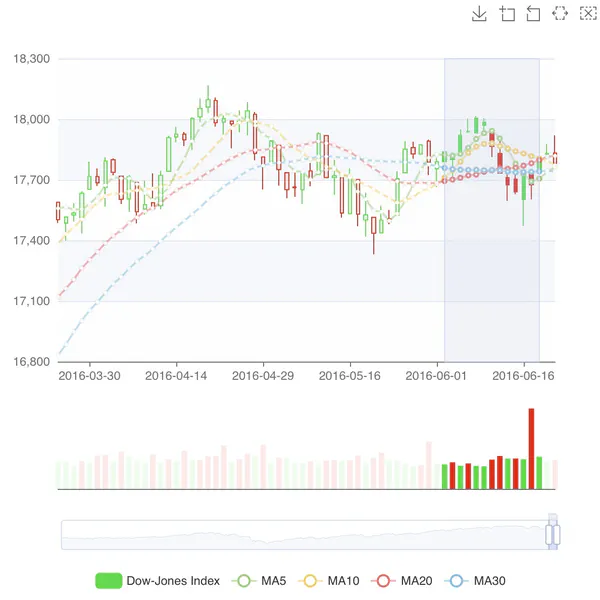
Candlestick
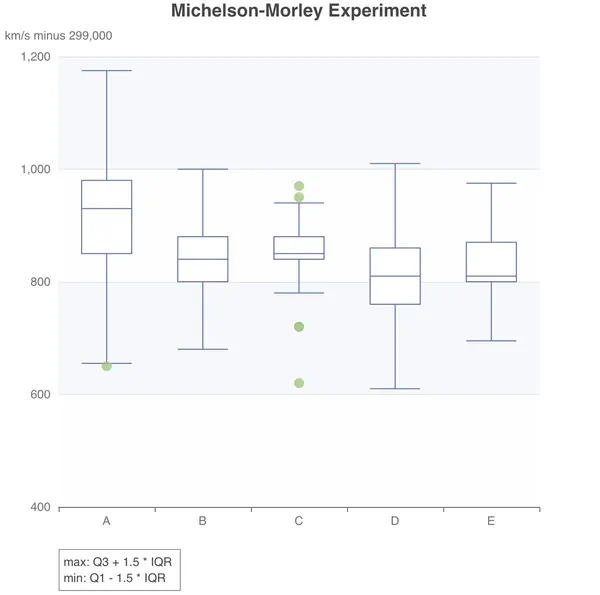
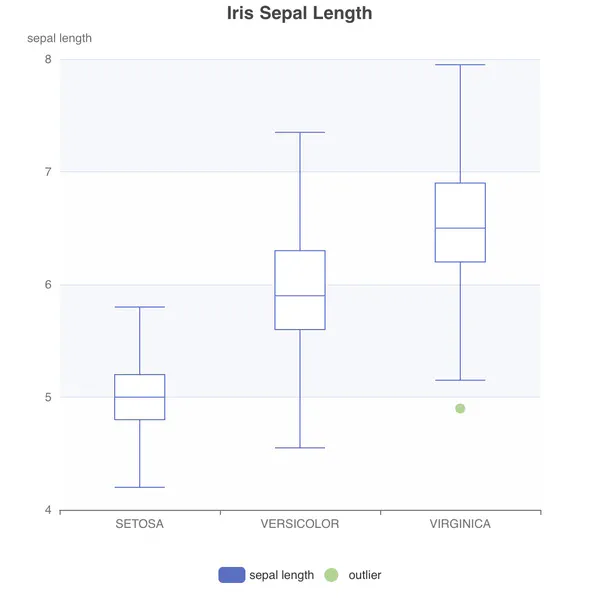
Boxplot
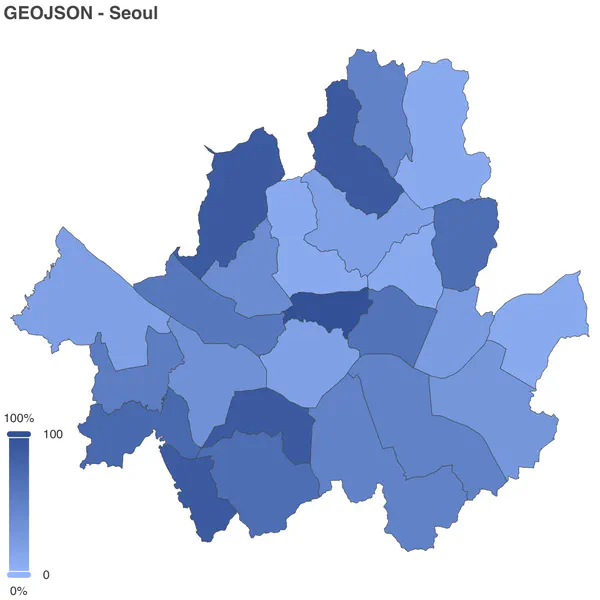
GeoJSON
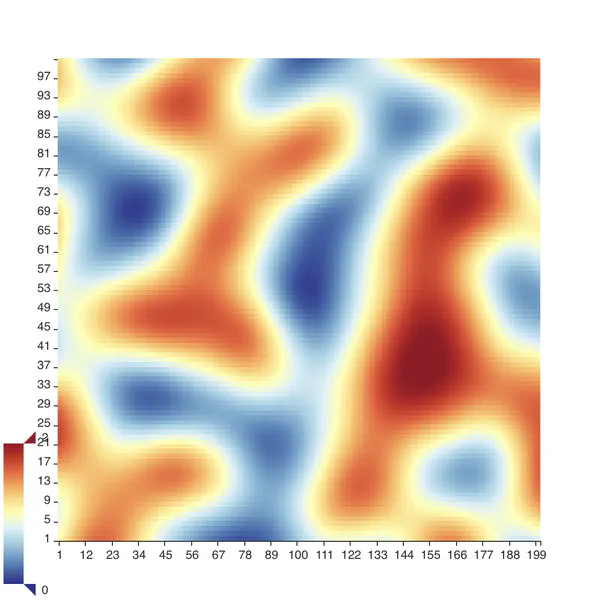
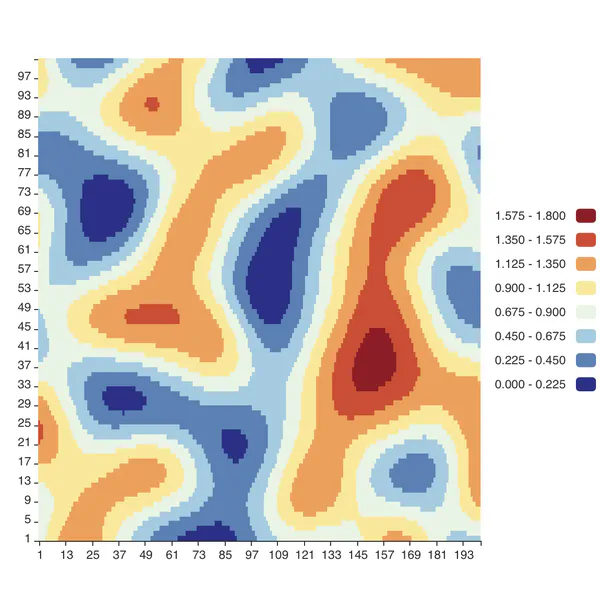
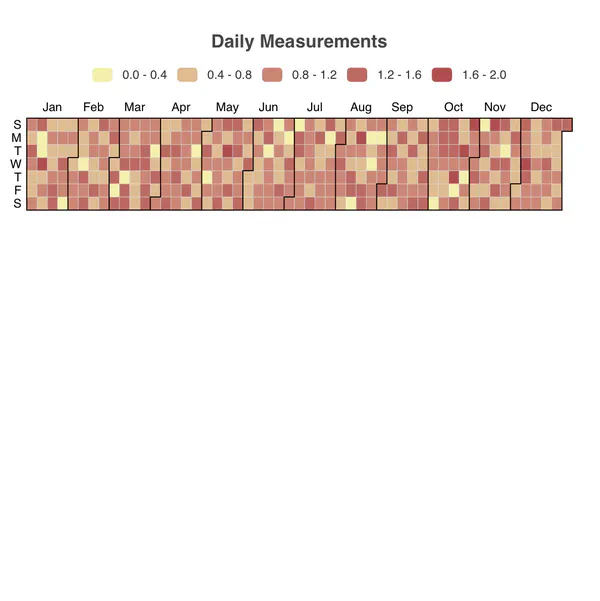
Heatmap
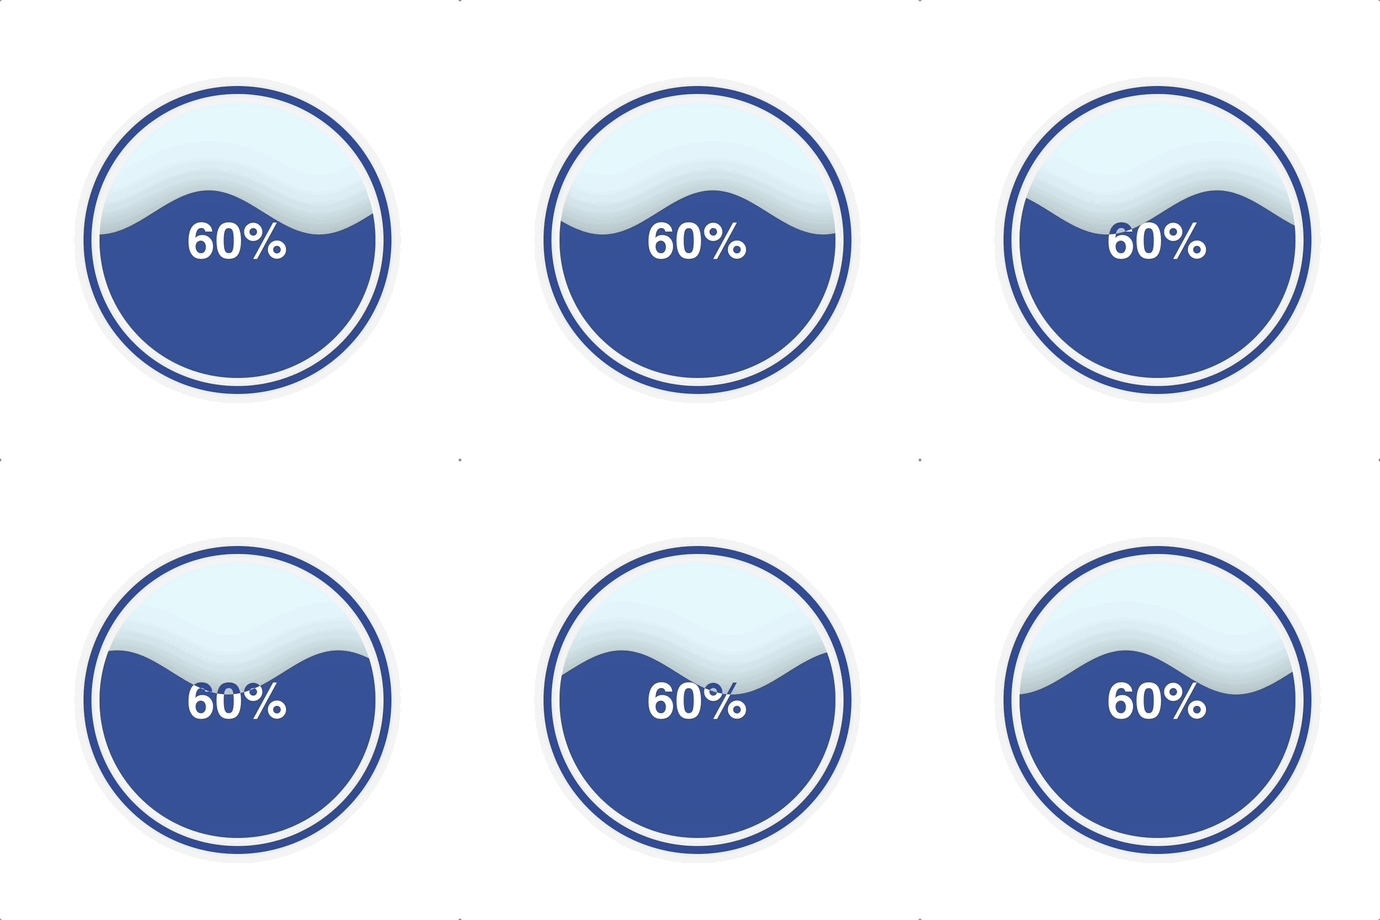
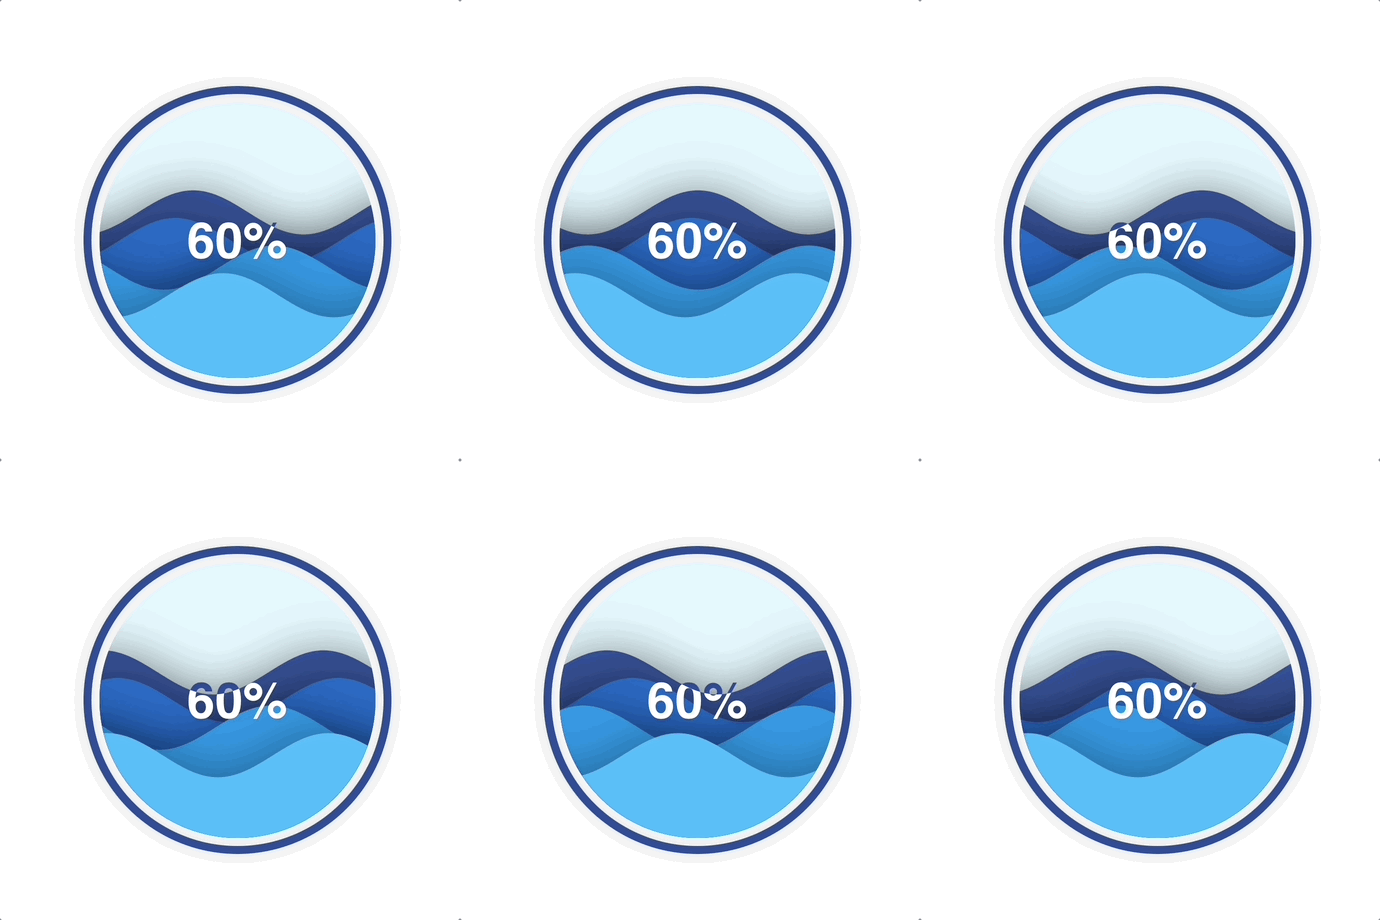
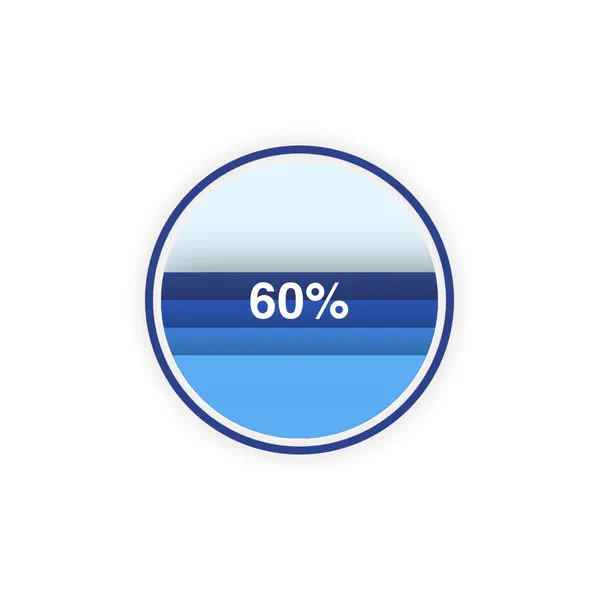
Liquidfill
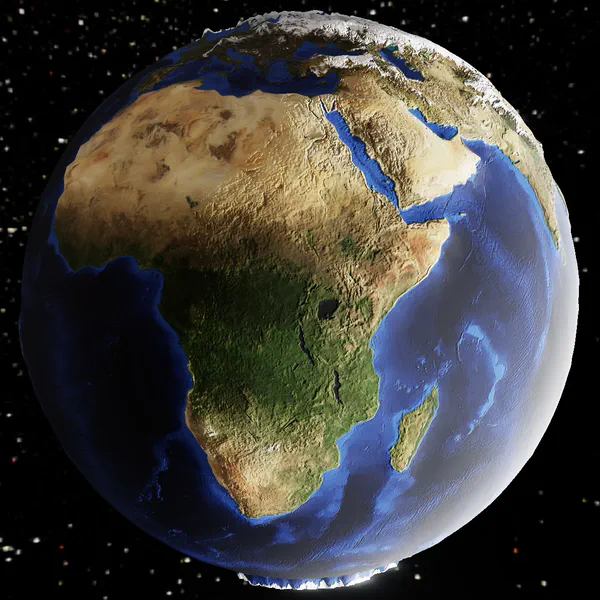
3D Globe

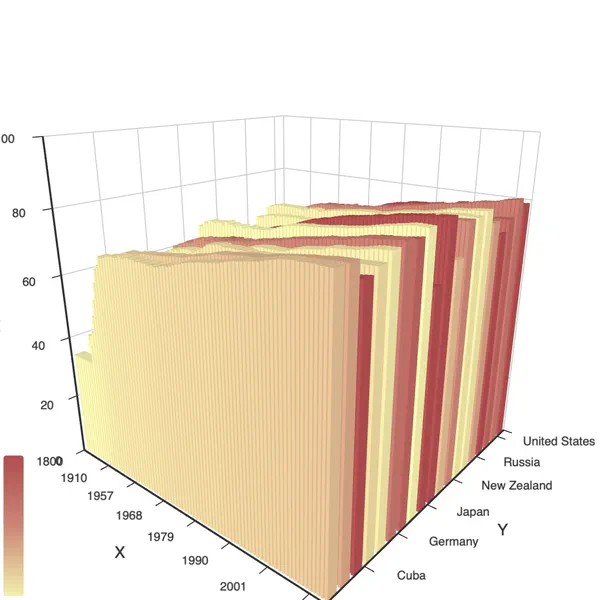
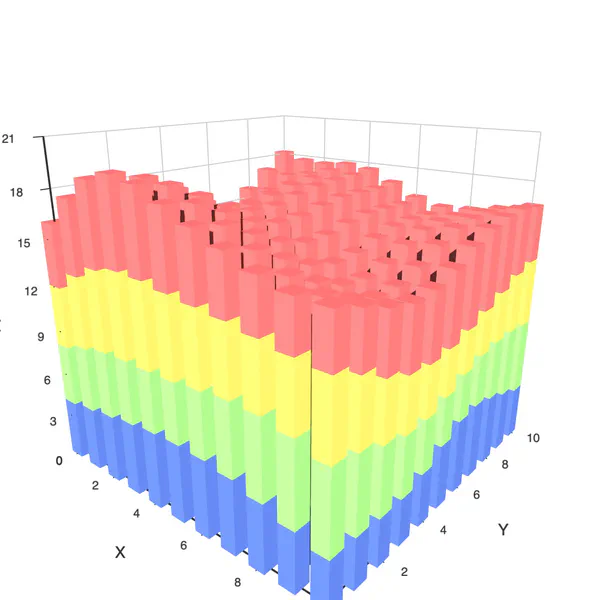
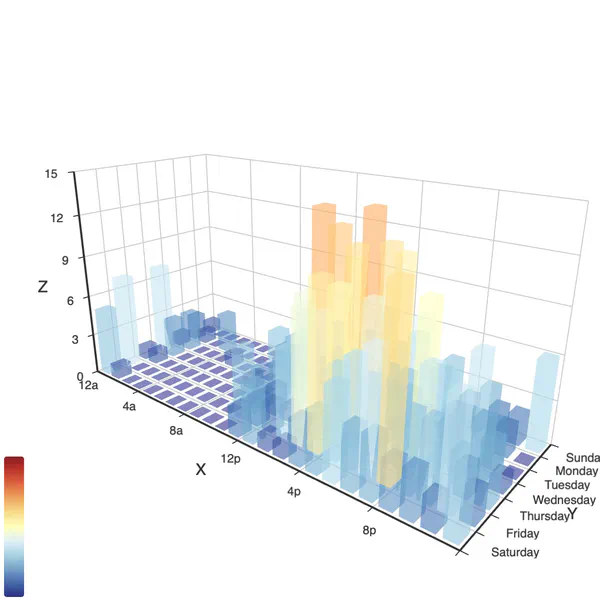
3D Bar
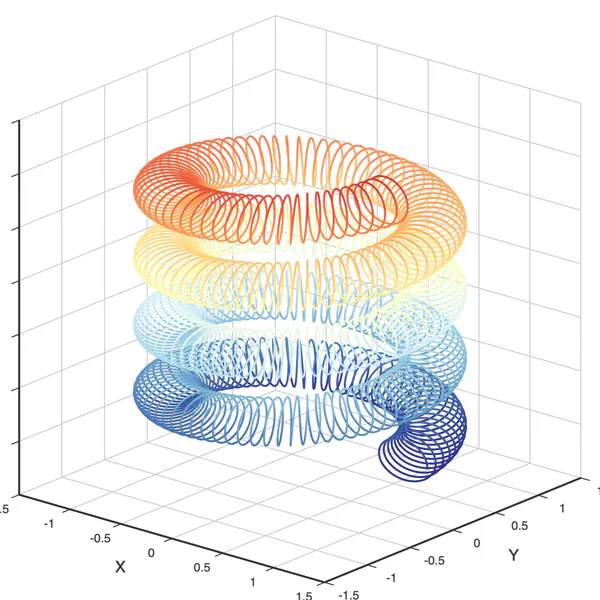
3D Line
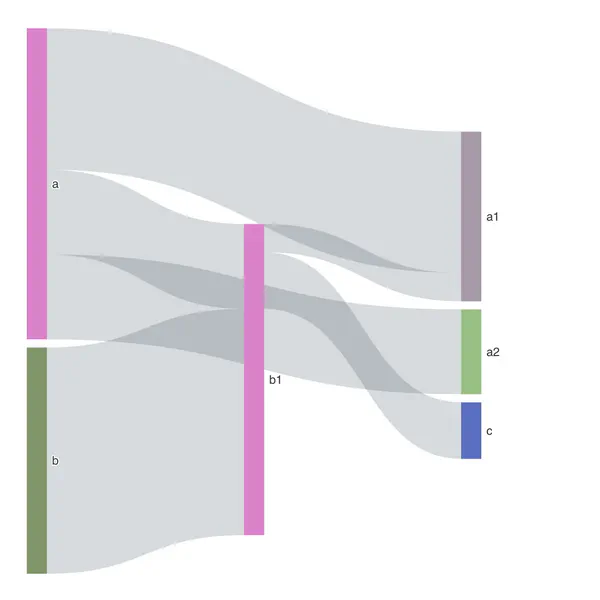
Others
Themes
| |
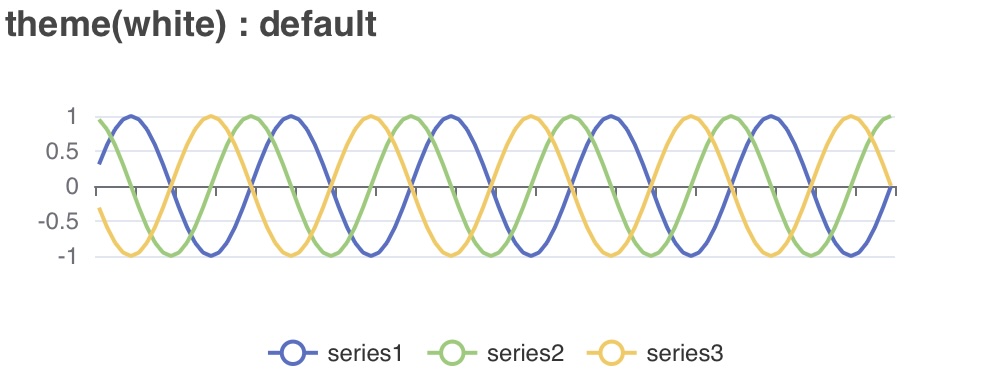
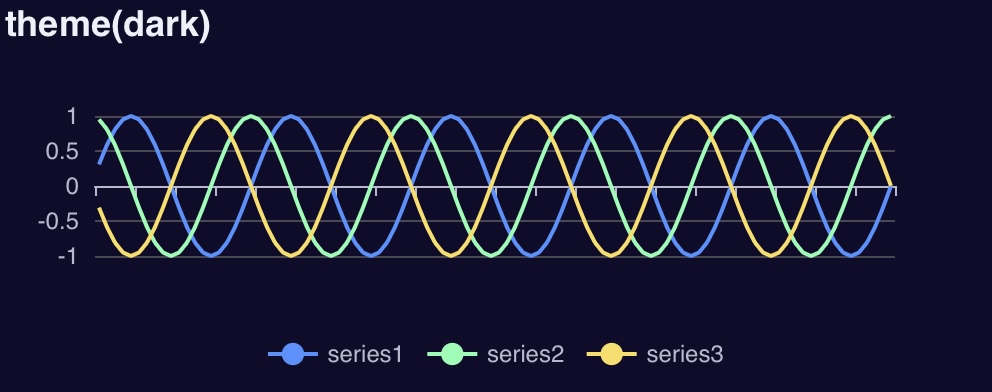
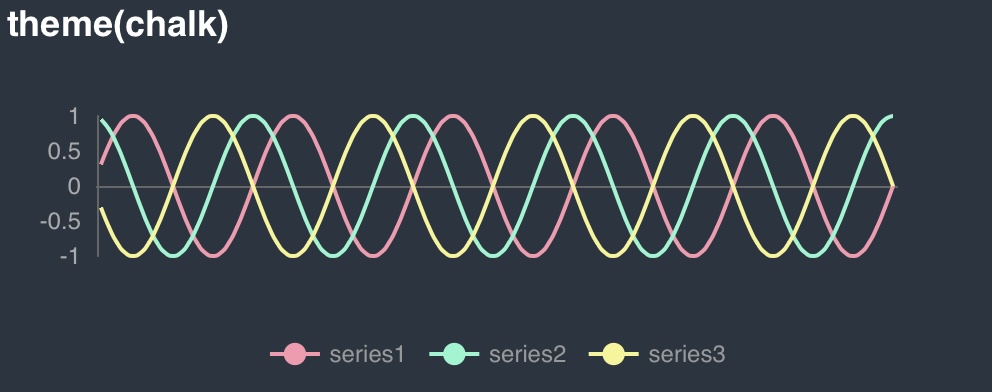
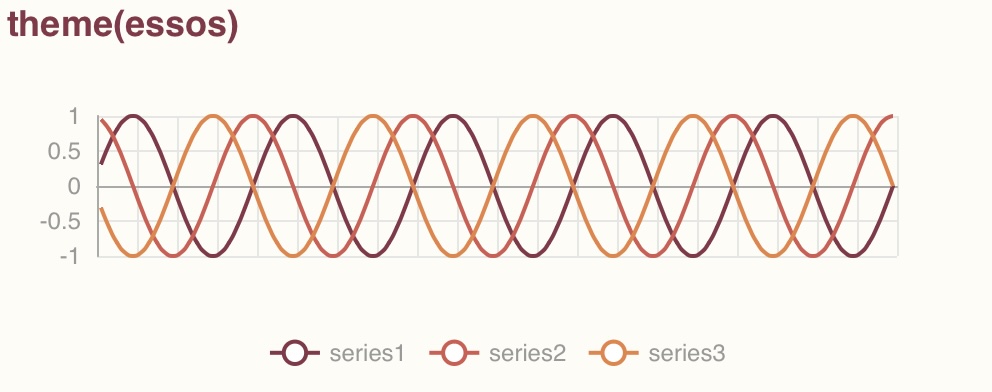
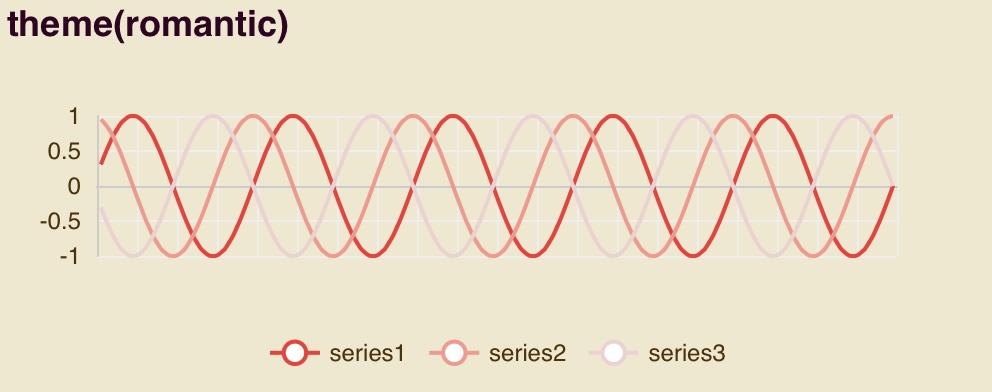
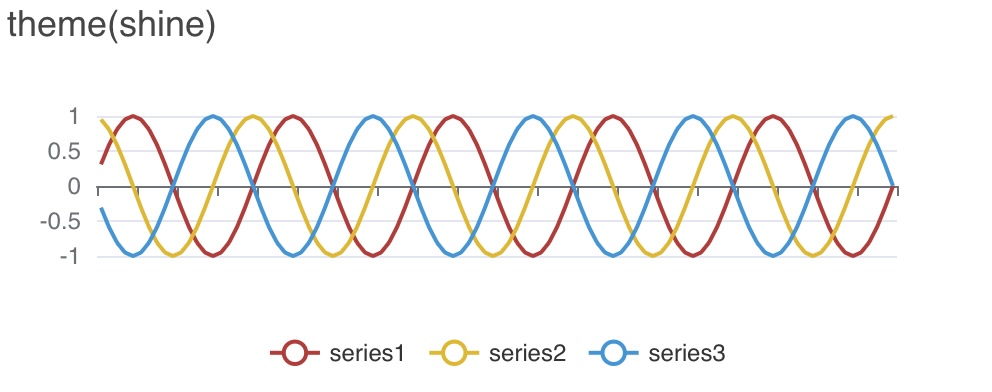
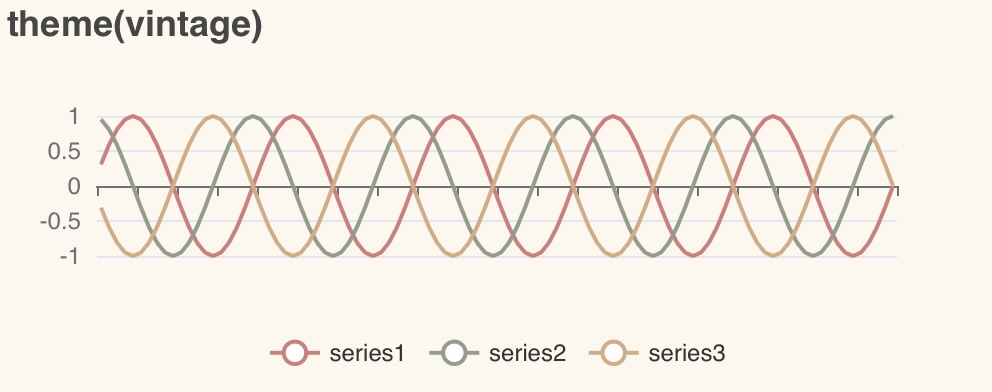
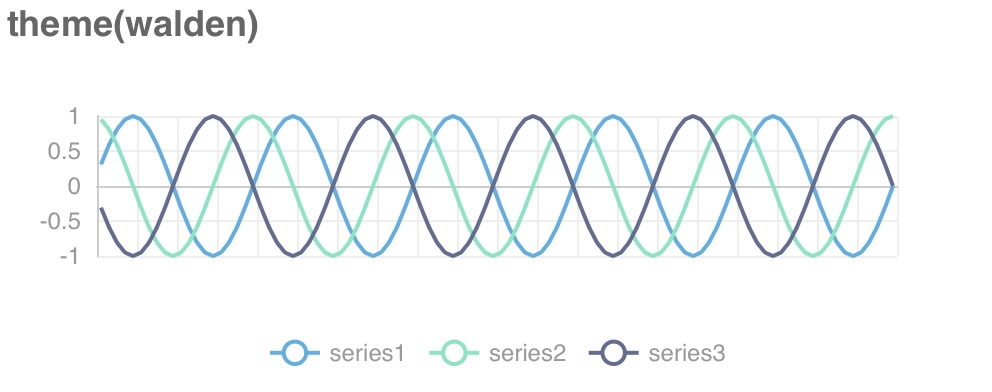
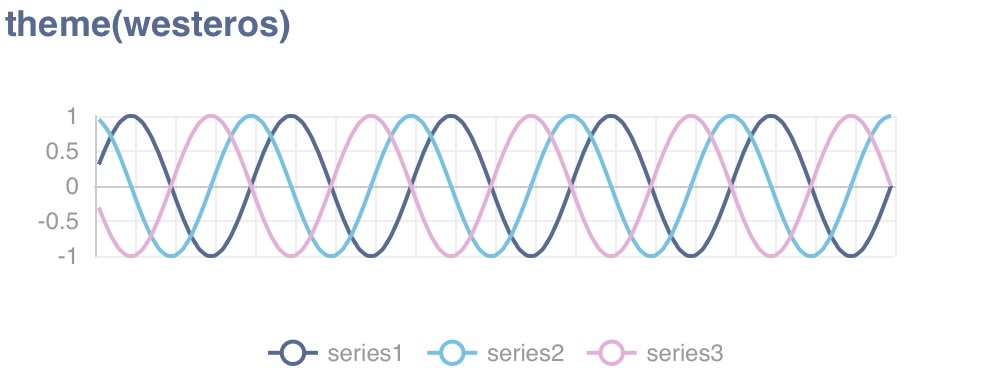
The images below show the chart with each theme applied.
white
dark
chalk
essos
infographic
macarons
purple-passion
roma
romantic
shine
vintage
walden
westeros
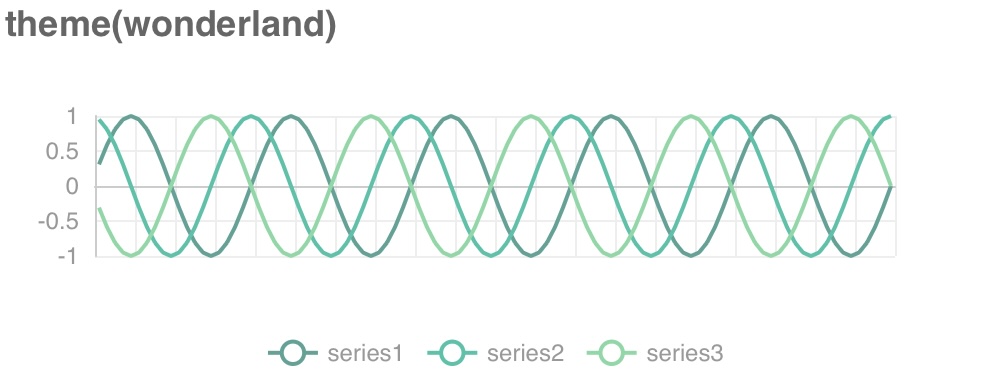
wonderland