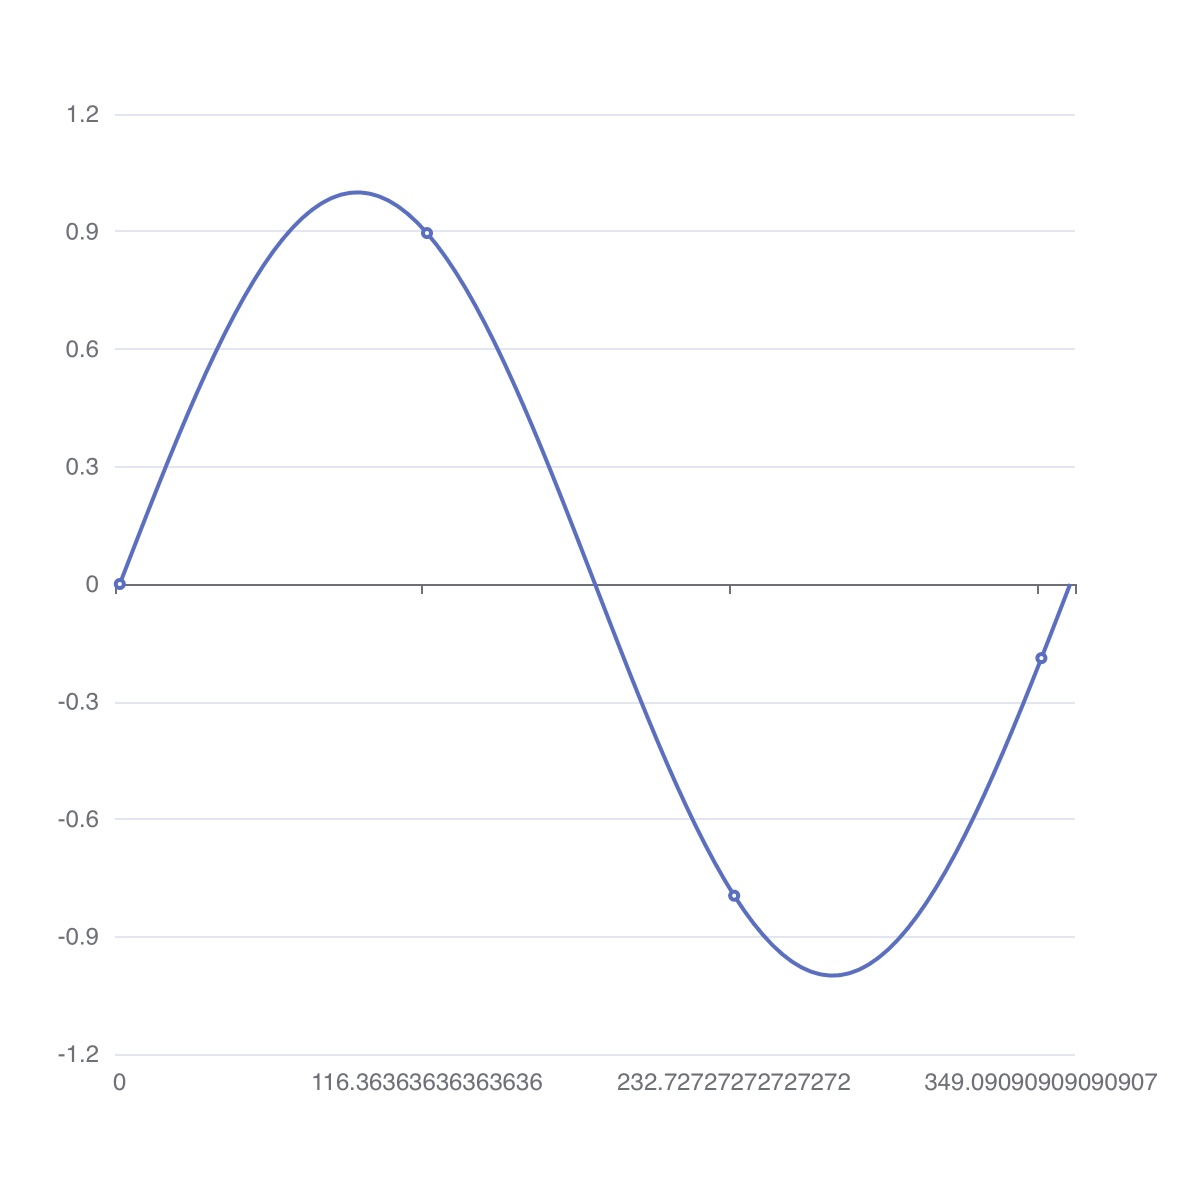
FAKE(arrange(1,100,1))// | 0
// +-> seq
// |
MAPVALUE(1,sin((2*PI*value(0)/100)))// | 0 1
// +-> seq value
// |
MAPVALUE(0,timeAdd("now-100s",strSprintf("+%.fs",value(0))))// | 0 1
// +-> time value
// |
PUSHVALUE(0,"chart-line")// | 0 1 2
// +-> name time value
// |
APPEND(table("example"))
Prepare data with SCRIPT
1
2
3
4
5
6
7
8
9
10
SCRIPT({const{arrange}=require("mathx");now=(newDate()).getTime()-100*1000;// now - 100s.
for(xofarrange(1,100,1)){y=Math.sin(x/100*2*Math.PI)ts=newDate(now+x*1000);// add 1 sec.
$.yield("chart-line",ts,y);}})APPEND(table("example"))
SQL() to CHART()
 1
 2
 3
 4
 5
 6
 7
 8
 9
10
11
12
13
14
15
16
17
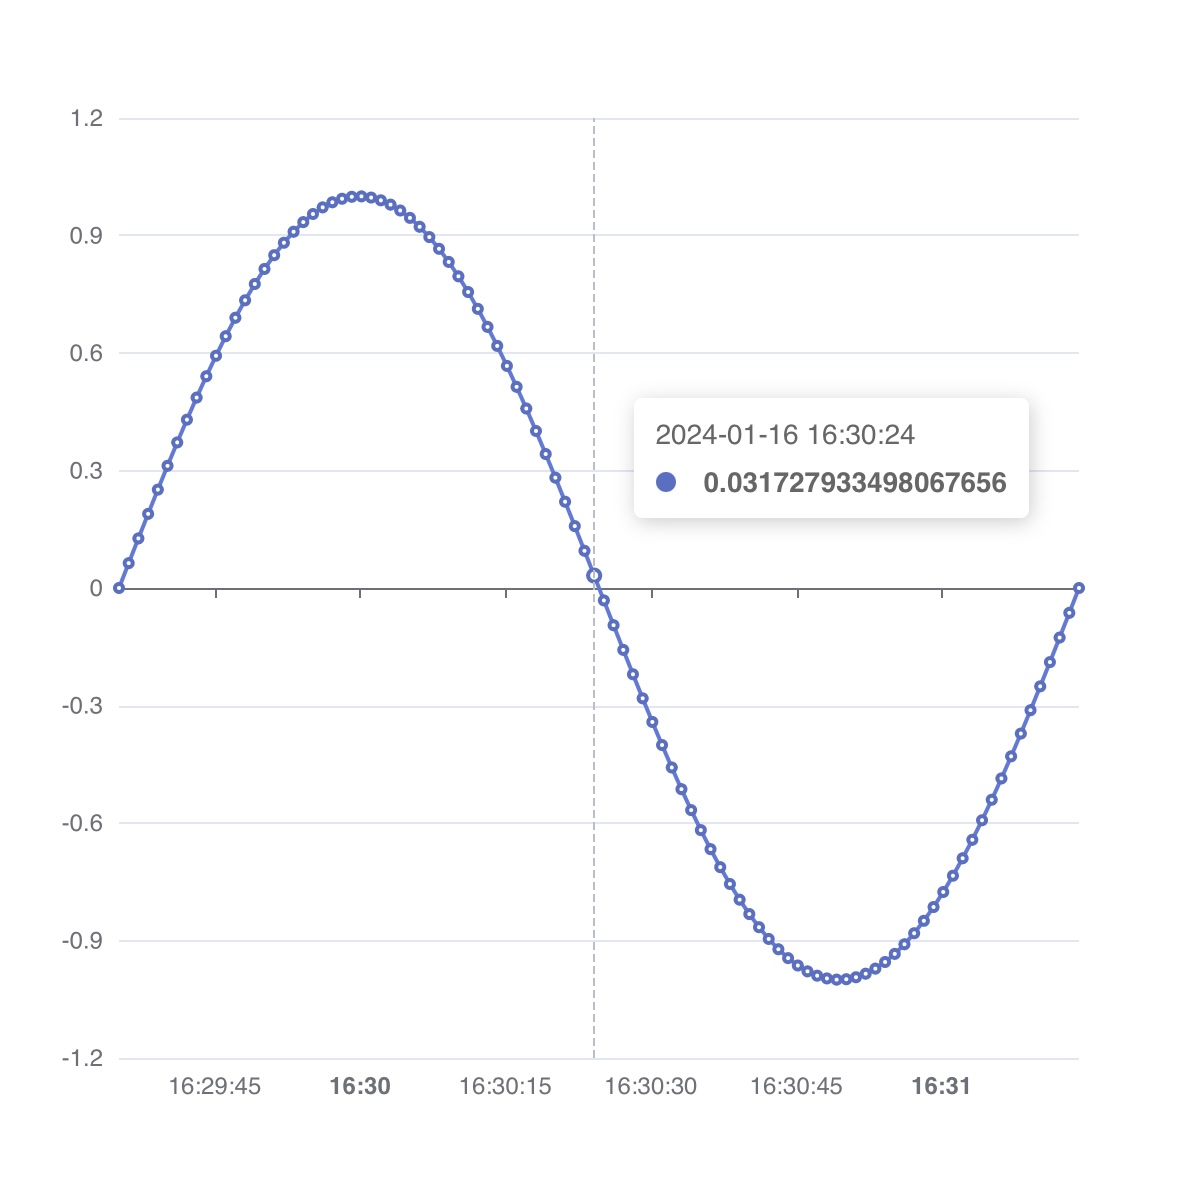
SQL(`select time, value from example where name = 'chart-line'`)SCRIPT({$.yield([$.values[0],$.values[1]])})CHART(chartOption({xAxis:{type:"time"},yAxis:{},tooltip:{trigger:"axis"},series:[{type:"line",data:column(0)}]}))
SCRIPT({const{Client}=require("machcli");vardb,conn,rows;vardata=[];constconf={user:'sys',password:'manager'};try{db=newClient(conf);conn=db.connect();rows=conn.query(`select time, value from example where name = ?`,'chart-line')for(rofrows){data.push([r.time,r.value]);}}catch(e){console.println("ERROR",e.message);}finally{rows&&rows.close();conn&&conn.close();db&&db.close();}$.yield({xAxis:{type:"time"},yAxis:{},tooltip:{trigger:"axis"},series:[{type:"line",data:data,}]})})CHART()
SQL(`select time, value from example where name = 'chart-line'`)
SCRIPT({
data = [];
}, {
data.push([$.values[0], $.values[1]]);
}, {
$.yield(data);
})
HTML(template({
<span><scriptsrc="/web/echarts/echarts.min.js"></script><divid='xyz'style="width:600px;height:400px;"></div><script>vardata={{.Values}};varchartDom=document.getElementById('xyz');varmyChart=echarts.init(chartDom);varoption={xAxis:{type:"time"},yAxis:{},tooltip:{trigger:"axis"},series:[{type:'line',data:data[0],symbol:"none"}]};option&&myChart.setOption(option);</script></span>}))