GEOMAP()
Syntax: GEOMAP( [geomapID()] [, tileTemplate()] [, size()] )
GEOMAP generates a map display and shows markers and geometric shapes based on provided coordinates.
It functions similarly to CHART, but it uses coordinates instead of scalar values. The supported coordinates system is WGS84.
The GEOMAP() function processes input data in JavaScript Object format.
Each input object must include type and coordinates fields, with an optional properties field.
A layer in the GEOMAP() function is an object that is rendered on the map according to its specified type.
For example, a layer with the type circle will display a circle on the map based on the provided properties.
tileTemplate()
Syntax: tileTemplate(url_template)
The map tile server url template.
The default is https://tile.openstreetmap.org/{z}/{x}/{y}.png.
Important : If the map clients (web browsers) cannot access the default tile server due to the firewall and organization’s security policy, you will need to run your own tile server inside your organization and set the tile server URL using
tileTemplate(). Instructions on how to run a tile server are beyond the scope of this document. Please refer to the following for more information about the tile server: https://wiki.openstreetmap.org/wiki/Tile_servers
tileGrayscale()
Syntax tileGrayscale(scale)
scalefloat Set the gray scale of the tile image it should be 0 ≤ scale ≤ 1.0. (Default:0)
geomapID()
Syntax: geomapID(id)
If you need to specify the map id (string) instead of auto-generated one.
size()
Syntax: size(width, height)
widthstring map width in HTML syntax ex)'800px'heightstring map height in HTML syntax ex)'800px'
Layers
Layers are markers and geometric shapes that GEOMAP shows on the map.
The input data of GEOMAP() should be a dictionary structure represented as a JavaScript object.
The object must have type and coordinates fields, with an optional properties field.
syntax
{
    type: "circle", // marker, circleMarker, polyline ...
    coordinates: [Lat, Lon],
    properties: {
        radius: Radius,
        color: "#FF0000",
        weight: 1
    }
}| Name | Type | Description |
|---|---|---|
type | String | Type of the layer. e.g., marker, circle, circleMarker, etc. |
coordinates | []Float,[][]Float, … | Coordinates for the type in [latitude, longitude] order |
properties | Dictionary | Various options depending on the type.See Properties |
marker
| |

circleMarker
Properties
| Property | Default | Description |
|---|---|---|
radius | 10 | Radius of the circle marker, in pixels. |
| |

circle
Properties
| Property | Default | Description |
|---|---|---|
radius | 10 | Radius of the circle, in meters. |
| |

polyline
FAKE(json({
    [45.51, -122.68],
    [37.77, -122.43],
    [34.04, -118.2]
}))

SCRIPT({
    var points = [];
    function finalize() {
        $.yield({
            type: "polyline",
            coordinates: points
        });
    }
},{
    var lat = $.values[0];
    var lon = $.values[1];
    points.push( [lat, lon] );
})

GEOMAP()
polygon
FAKE(json({
    [37, -109.05],
    [41, -109.03],
    [41, -102.05],
    [37, -102.05]
}))

SCRIPT({
    var points = [];
    function finalize() {
        $.yield({
            type: "polygon",
            coordinates: points
        });
    }
},{
    var lat = $.values[0];
    var lon = $.values[1];
    points.push( [lat, lon] );
})

GEOMAP()
Properties
Layer Properties
| Property | Type | Default | Description |
|---|---|---|---|
stroke | Boolean | true | Whether to draw stroke along the path. Set it to false to disable borders on polygons or circles. |
color | String | '#3388ff' | Stroke color |
weight | Number | 3 | Stroke width in pixels |
opacity | Number | 1.0 | The opacity of the marker. |
fillColor | String | Fill color. Defaults to the value of the color property. | |
fillOpacity | Number | 0.2 | Fill opacity. |
popup | Object | null | See Popup. |
tooltip | Object | null | See Tooltip. |
Popup
If layer properties has popup object it displays popup message when user click the layer.
| Property | Type | Default | Description |
|---|---|---|---|
content | String | The content of the popup in Text/HTML. | |
open | Boolean | false | Set initial open state |
maxWidth | Number | 300 | Max width of the popup, in pixels. |
minWidth | Number | 50 | Min width of the popup, in pixels. |
| |

Tooltip
Since v8.0.44Used to display small texts on top of map layers.
| Property | Type | Default | Description |
|---|---|---|---|
content | String | The content of the popup in Text/HTML. | |
open | Boolean | false | Set initial open state |
direction | String | auto | Direction where to open the tooltip. right,left,top,bottom,center,auto |
permanent | Boolean | false | Whether to open the tooltip permanently or only on mouseover |
opacity | Number | 0.9 | Tooltip container opacity |
| |

Examples
Load test data from a CSV file and insert it into the “TRIP” table. This TQL downloads the CSV file from the given URL, converts the CSV strings into the appropriate data types, and inserts the records into the TRIP table.
| |
Trajectory
| |

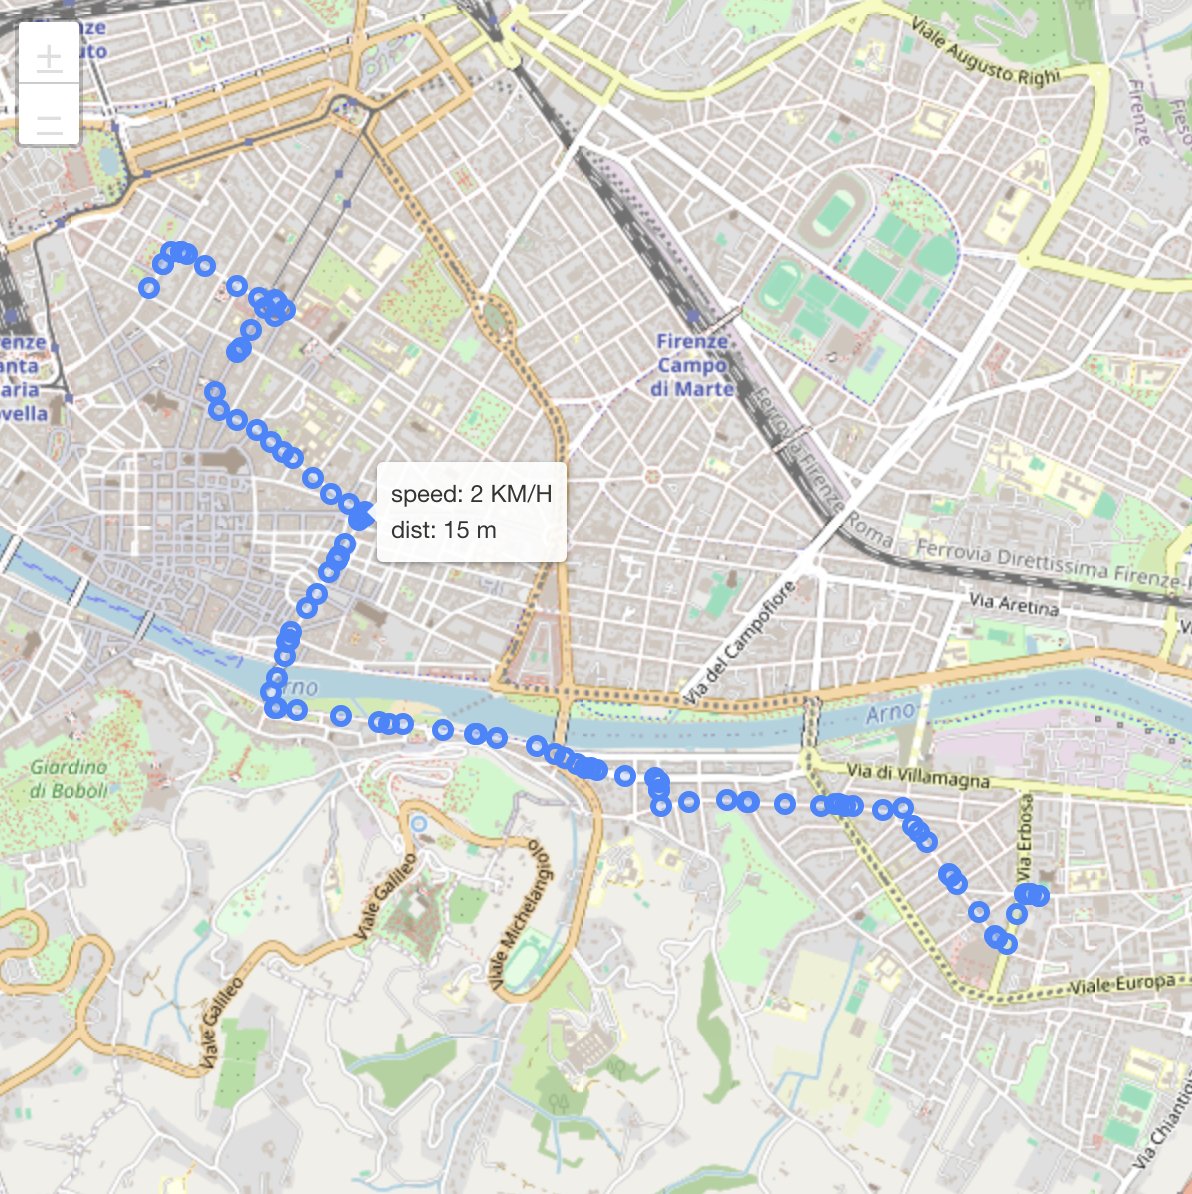
Distance and Speed
Using the Haversine formula to calculate the distance moved in meters between two points, then computing the moving speed in kilometers per hour (Km/H) based on the time difference between these points.
| |